Fig. 8
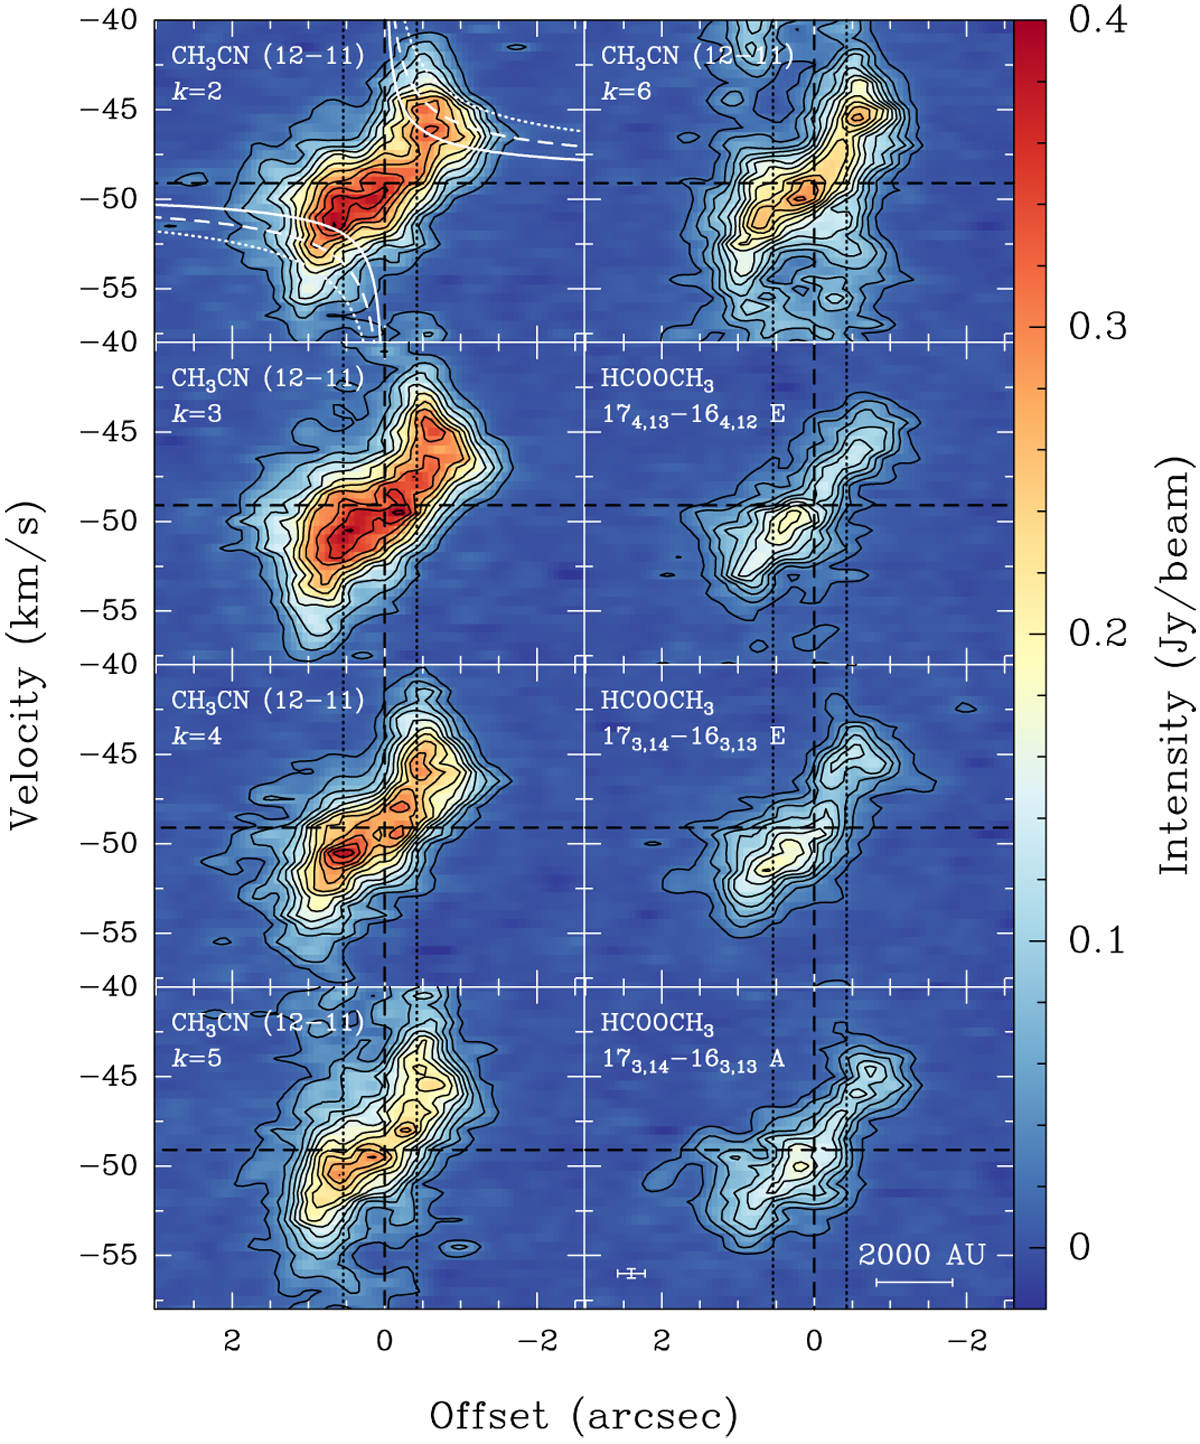
Position–velocity plots of W3(H2O) for a cut in the direction of rotation as depicted by a dashed line in the bottom left panel of Fig. 5 for various species and transitions in the ABD configuration. The vertical dashed lines correspond to the centre of the cut. The vertical dotted lines correspond to the positions of continuum peaks corresponding to W3(H2O) E and W3(H2O) W. The horizontal dashed lines correspond to the LSR velocity of W3(H2O). The black contours start at 4σ and increase in steps of 6σ. The white solid, dashed, and dotted lines in the top left panel correspond to the region within which emission is expected if the gas is in a disk in Keplerian rotation about a 10, 25, 50 M⊙ star, respectively.The white curves are not fits to the rotation curve, but are drawn to guide the eye. A scale bar and a cross that corresponds to the spatial and spectral resolutions are shown in the bottom right panel.
Current usage metrics show cumulative count of Article Views (full-text article views including HTML views, PDF and ePub downloads, according to the available data) and Abstracts Views on Vision4Press platform.
Data correspond to usage on the plateform after 2015. The current usage metrics is available 48-96 hours after online publication and is updated daily on week days.
Initial download of the metrics may take a while.