Fig. 7
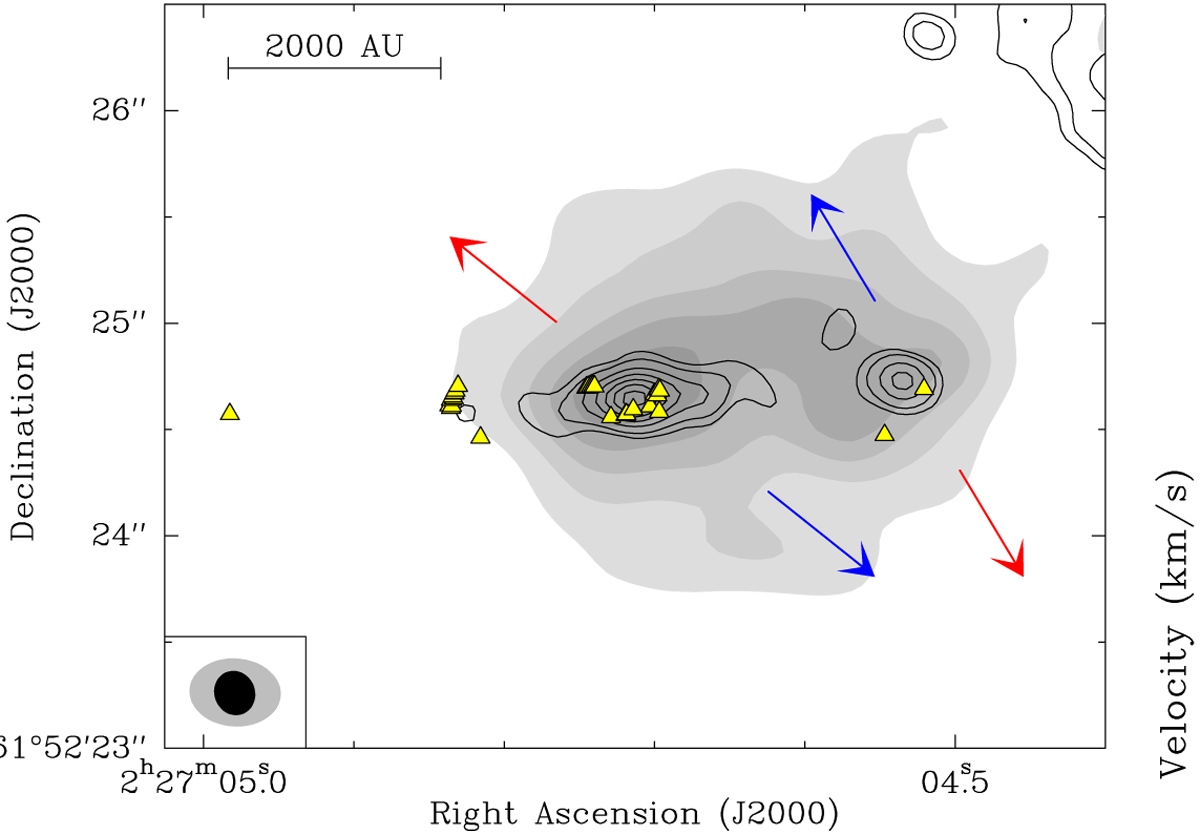
NOEMA 1.37 mm (219 GHz) continuum image toward W3(H2O) in grey with levels starting at 6σ and increasing in steps of 6σ. The black contours correspond to the cm emission from Wilner et al. (1999). The positions of H2O masers obtained from Hachisuka et al. (2006) are plotted as yellow triangles. The blue and red arrows show the directions of bipolar molecular outflows from Zapata et al. (2011; see Fig. 6). The synthesised beam size of the cm emission (0.′′ 21×0.′′19, PA = 68°) is shown in black in the bottom left corner. The synthesised beam size of our mm continuum image is shown in grey in the bottom left corner.
Current usage metrics show cumulative count of Article Views (full-text article views including HTML views, PDF and ePub downloads, according to the available data) and Abstracts Views on Vision4Press platform.
Data correspond to usage on the plateform after 2015. The current usage metrics is available 48-96 hours after online publication and is updated daily on week days.
Initial download of the metrics may take a while.