Fig. 6
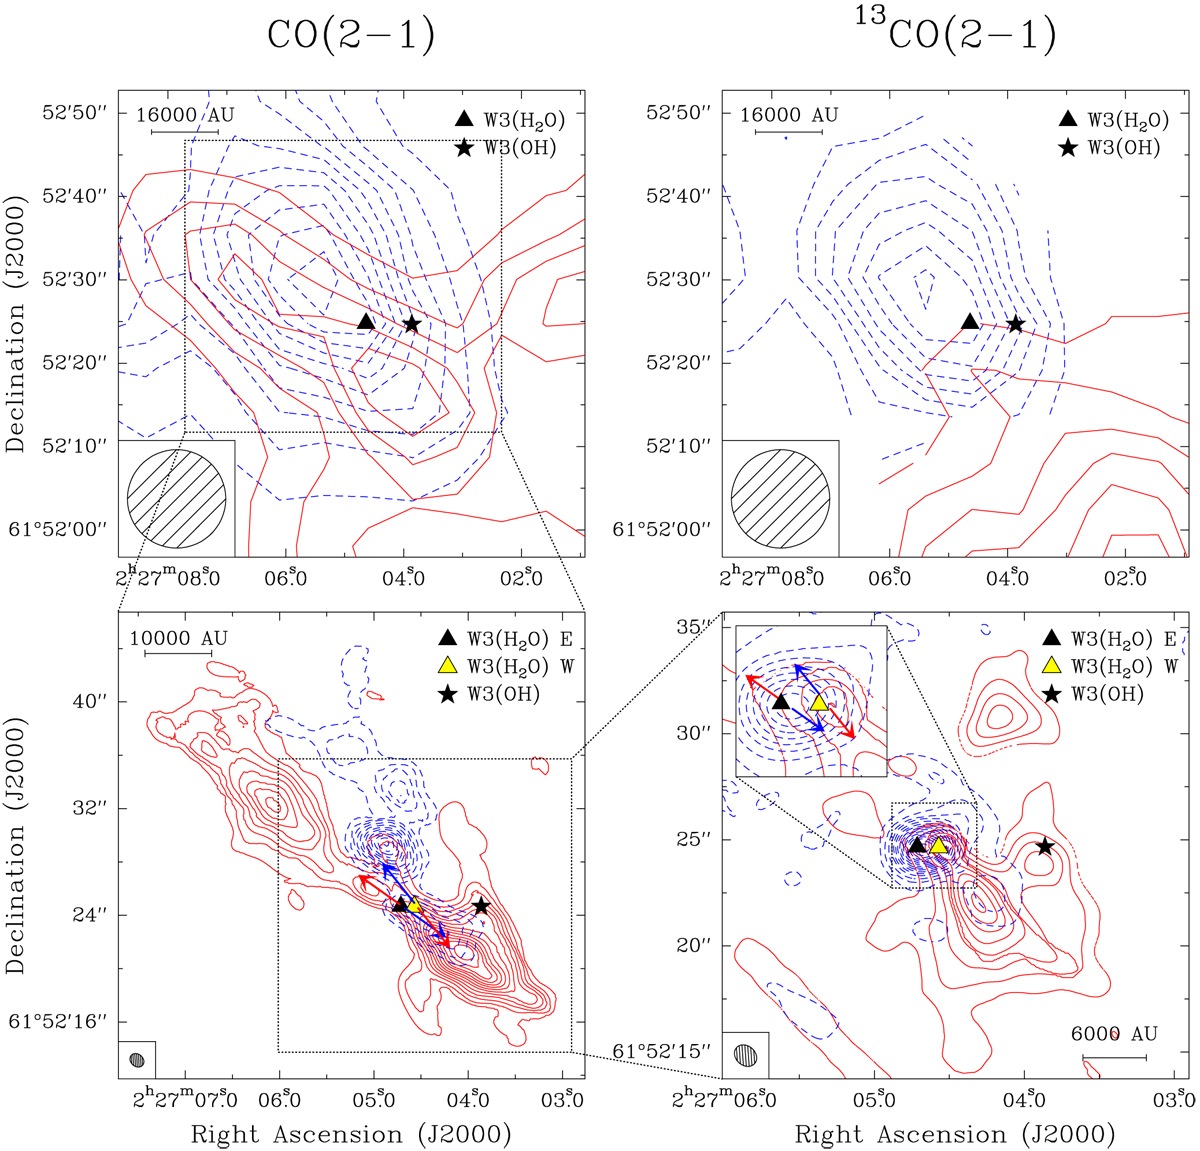
Top left panel: intensity map of CO (2–1) emission from IRAM 30 m integrated over the velocity range from − 40 to − 20 km s−1 for the redshifted and from − 80 to − 55 km s−1 for the blueshifted gas. Contours start at 5σ and increase in steps of 5σ (1σ = 1.9 K km s−1). Top right panel: intensity map of 13CO (2–1) emission from IRAM 30 m integrated over the velocity range from − 40 to − 20 km s−1 for the redshifted and from − 80 to − 55 km s−1 for the blueshifted gas. Contours start at 3σ and increase in steps of 2σ (1σ = 0.42 K km s−1). Bottom left panel: intensity map of CO (2–1) emission obtained by Zapata et al. (2011) with the SMA integrated over the velocity range from − 45 to − 25 for the redshifted and from − 75 to − 55 for the blueshifted gas. Contours start at 5σ and increase in steps of 5σ (1σ = 1.1 mJy beam−1 km s−1). The blue and red arrows highlight the positions and directions of the CO outflows emanating from each source. Bottom right panel: intensity map of 13CO (2–1) emission from IRAM 30 m merged with NOEMA observations integrated over the velocity range from − 41 to − 30 for the redshifted and from − 70 to − 53 for the blueshifted gas. Contours start at 3σ and increase in steps of 3σ (1σ = 0.03 mJy beam−1 km s−1 for redshifted and 0.17 mJy beam−1 km s−1 for blueshifted sides). The zoom panel in the top left corner highlights the launching positions of each outflow, with the red and blue arrows showing the directions of the two bipolar outflows from Zapata et al. (2011). The rms noise used in drawing the contours of the integrated intensity maps have been determined by first creating the maps without any constraints on the minimum emission level (threshold of 0) and calculating the noise in an emission-free part of the resulting map.
Current usage metrics show cumulative count of Article Views (full-text article views including HTML views, PDF and ePub downloads, according to the available data) and Abstracts Views on Vision4Press platform.
Data correspond to usage on the plateform after 2015. The current usage metrics is available 48-96 hours after online publication and is updated daily on week days.
Initial download of the metrics may take a while.