Fig. 5
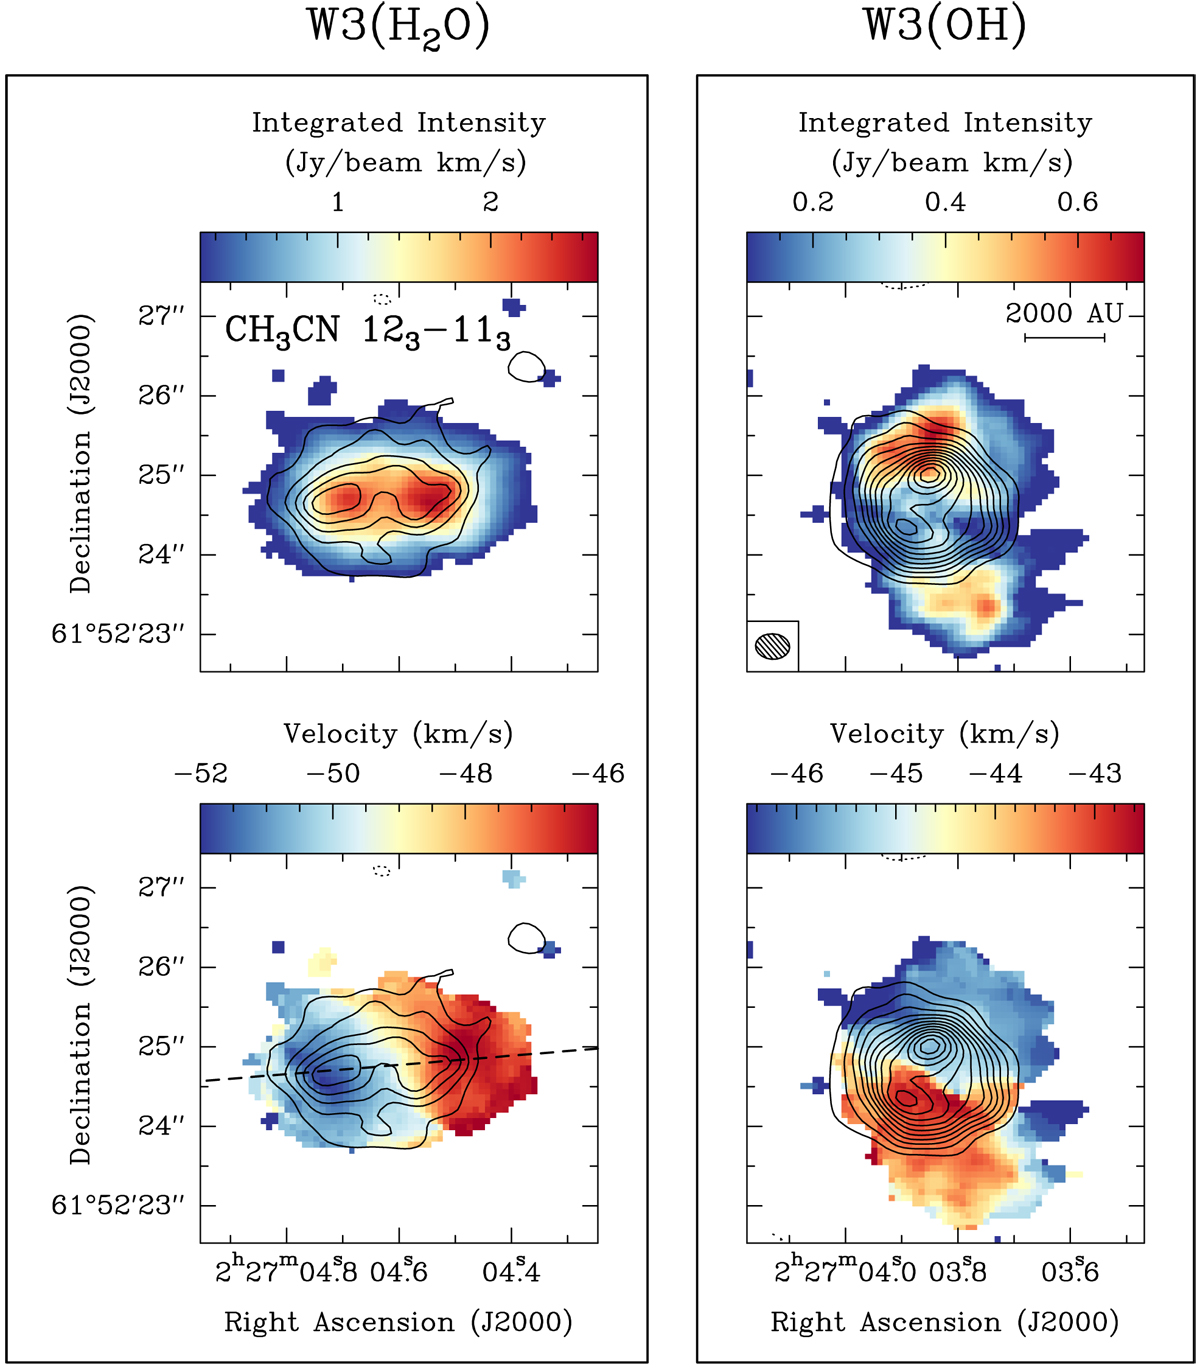
Top row: integrated intensity (zeroth moment) map of CH3CN (123−113) for W3(H2O) (left panel) and W3(OH) (right panel) in the ABD configuration. Bottom row: intensity-weighted peak velocity (first moment) map of CH3CN (123−113) for W3(H2O) (left panel) and W3(OH) (right panel) in the ABD configuration. The dashed line corresponds to the cut made for the PV plot of W3(H2O) presented in Fig. 8. The solid contours correspond to the 1.37 mm continuum, starting at 6σ and increasing in steps of 6σ (1σ = 3.2 mJy beam−1). The dotted contours correspond to the same negative levels. A scale bar and the synthesised beam (0.′′ 43×0.′′32, PA = 86°) are shown in the top right panel.
Current usage metrics show cumulative count of Article Views (full-text article views including HTML views, PDF and ePub downloads, according to the available data) and Abstracts Views on Vision4Press platform.
Data correspond to usage on the plateform after 2015. The current usage metrics is available 48-96 hours after online publication and is updated daily on week days.
Initial download of the metrics may take a while.