Fig. 4
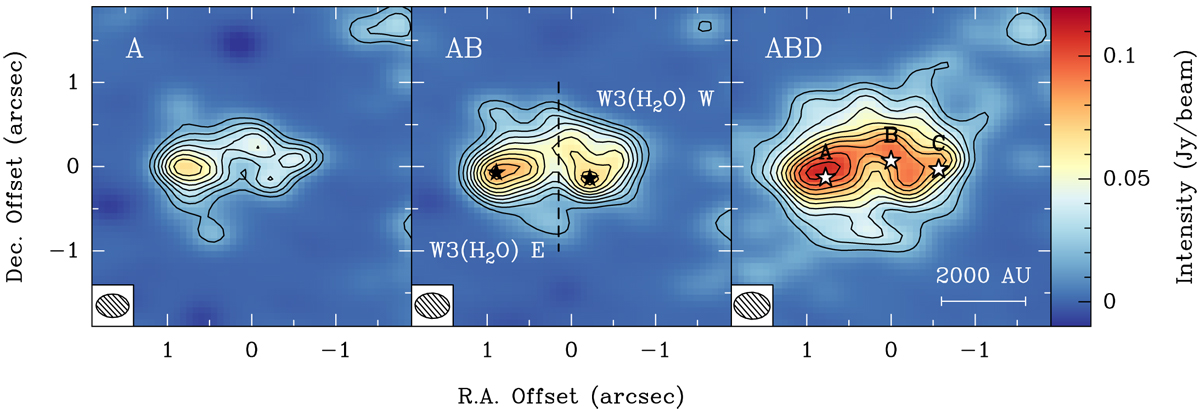
1.37 mm continuum image toward W3(H2O) observed with the A (left panel), AB (middle panel), and ABD (right panel) configurations of NOEMA. The solid contours start at 6σ and increase in steps of 3σ (see Table 4). Synthesised beams are shown in the bottom left corners of each panel, along witha scale bar in the bottom right of the right-hand panel. The black stars in the middle panel correspondto the positions of the continuum peaks, marking the locations of the two individual cores, W3(H2O) W and W3(H2O) E, with the dashed line as the approximate separation boundary. The white stars in the right panel correspond to the positions of the continuum peaks A, B, and C from Wyrowski et al. (1999). The offset zero position is the phase centre of the observations: α(J2000) = 02h 27m03. s87, δ(J2000) = 61°52′24.′′5.
Current usage metrics show cumulative count of Article Views (full-text article views including HTML views, PDF and ePub downloads, according to the available data) and Abstracts Views on Vision4Press platform.
Data correspond to usage on the plateform after 2015. The current usage metrics is available 48-96 hours after online publication and is updated daily on week days.
Initial download of the metrics may take a while.