Free Access
Fig. 3
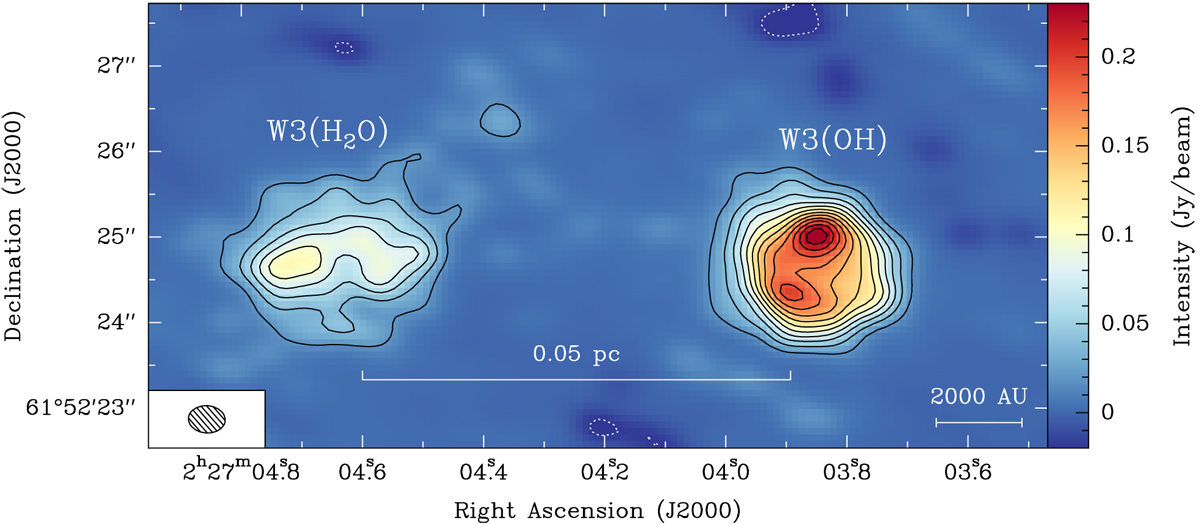
NOEMA 1.37 mm (219 GHz) continuum image toward W3(H2O) and W3(OH) in the ABD configuration. The solid contours start at 6σ and increase in steps of 6σ (1σ = 3.2 mJy beam−1). The dotted contours show the same negative levels. A scale bar and the synthesised beam (0.′′ 43×0.′′32, PA = 86°) are shown at the bottom.
Current usage metrics show cumulative count of Article Views (full-text article views including HTML views, PDF and ePub downloads, according to the available data) and Abstracts Views on Vision4Press platform.
Data correspond to usage on the plateform after 2015. The current usage metrics is available 48-96 hours after online publication and is updated daily on week days.
Initial download of the metrics may take a while.