Fig. C.1
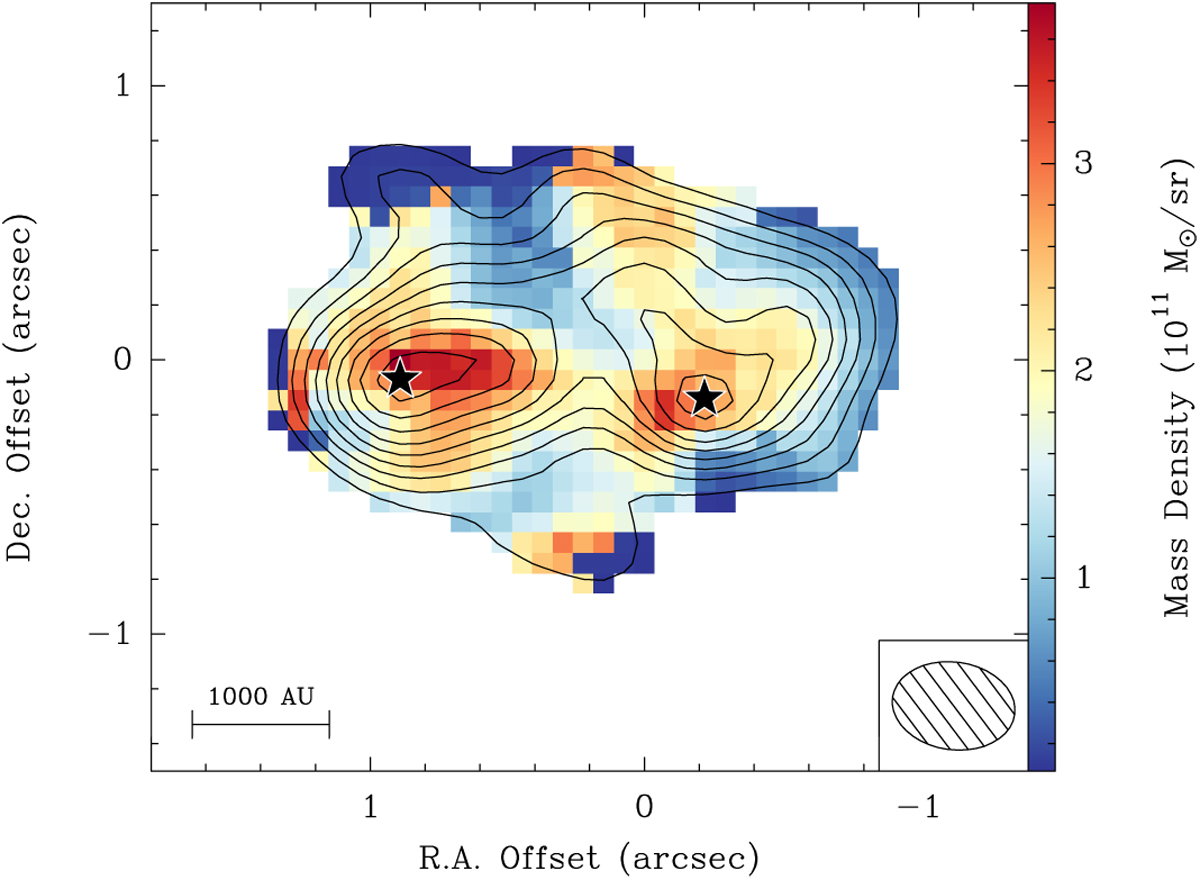
Mass density map obtained using the temperature and continuum maps in Eq. (2). The solid contours correspond to our continuum observations in the AB configuration, starting at 6σ and increasing in steps of 3σ (1σ = 2.5 mJy beam−1). Each of the peak continuum positions, as depicted by stars, is expected to host at least one 10 M⊙ (proto)star or more lower mass sources.
Current usage metrics show cumulative count of Article Views (full-text article views including HTML views, PDF and ePub downloads, according to the available data) and Abstracts Views on Vision4Press platform.
Data correspond to usage on the plateform after 2015. The current usage metrics is available 48-96 hours after online publication and is updated daily on week days.
Initial download of the metrics may take a while.