Fig. A.3
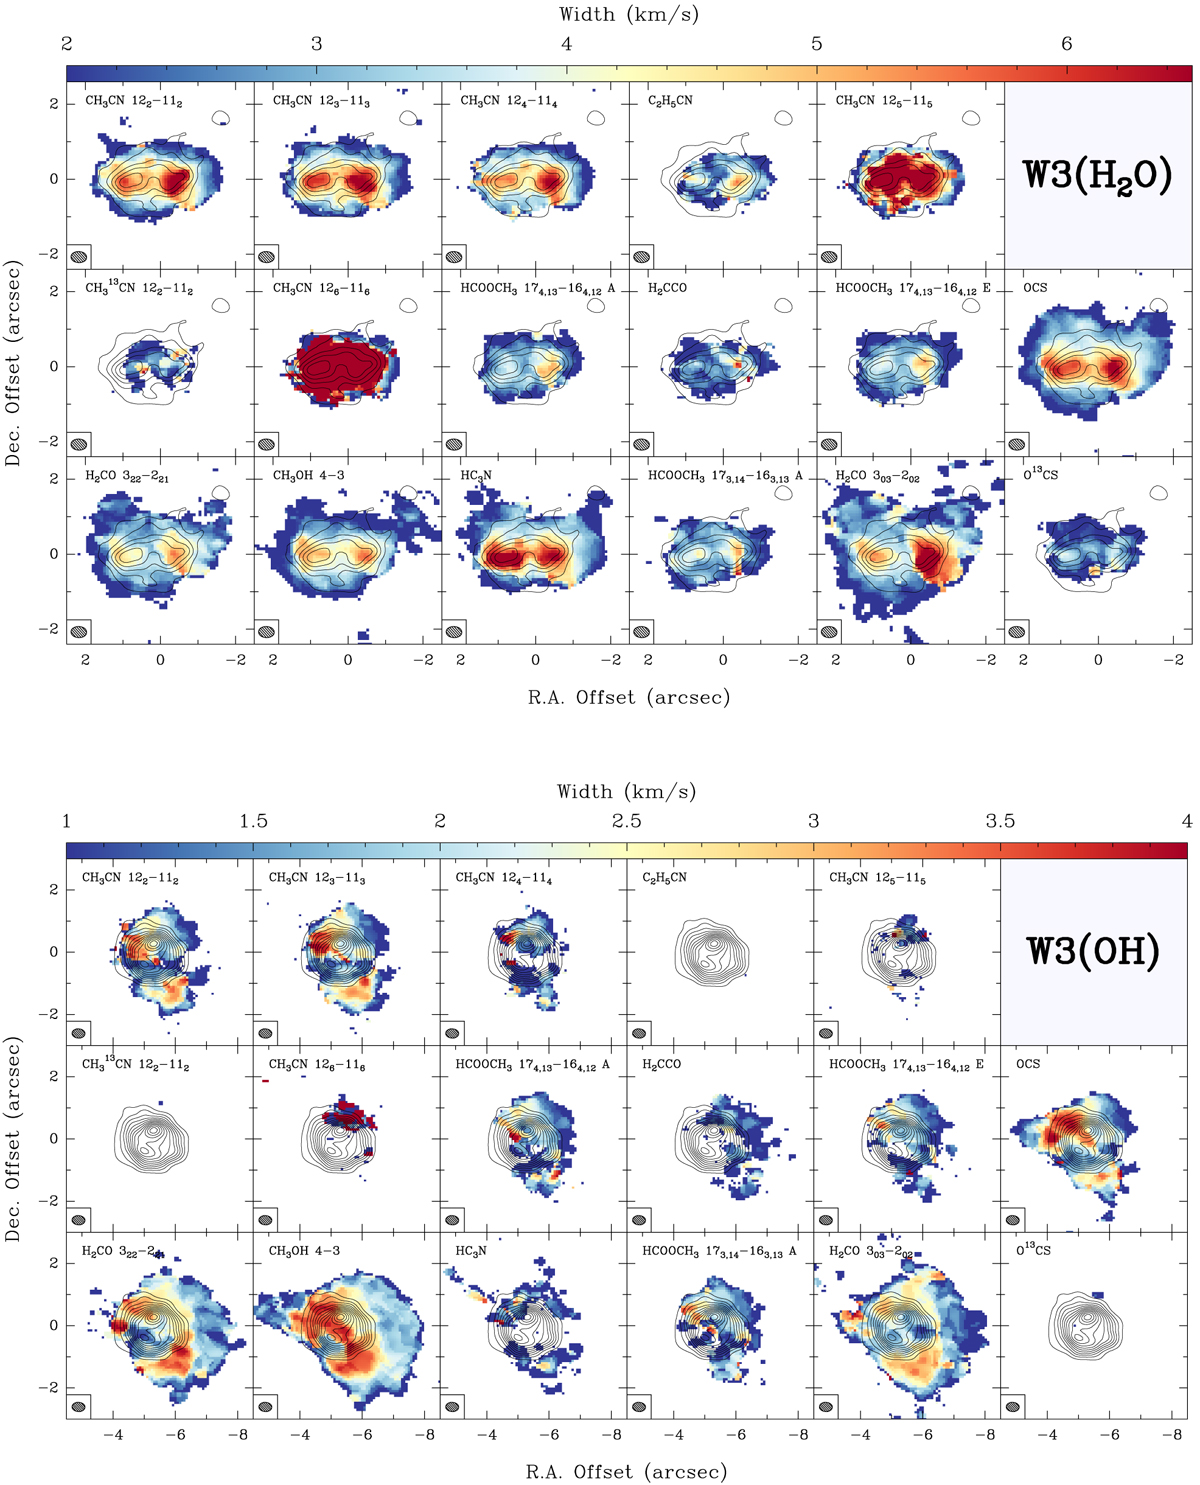
Root mean square velocity dispersion (second moment) maps of most important lines covered in the narrow-band receiver for the observations in the ABD configuration for W3(H2O) (top panel) and W3(OH) (bottom panel). The solid contours correspond to the dust continuum and start at and increase by 6σ (1σ = 3.2 mJy beam−1). The sizeof the synthesised beam is shown in the bottom left of each panel. The map of CH3CN (125−115) may not be accurate because it is blended with other lines.
Current usage metrics show cumulative count of Article Views (full-text article views including HTML views, PDF and ePub downloads, according to the available data) and Abstracts Views on Vision4Press platform.
Data correspond to usage on the plateform after 2015. The current usage metrics is available 48-96 hours after online publication and is updated daily on week days.
Initial download of the metrics may take a while.