Fig. 13
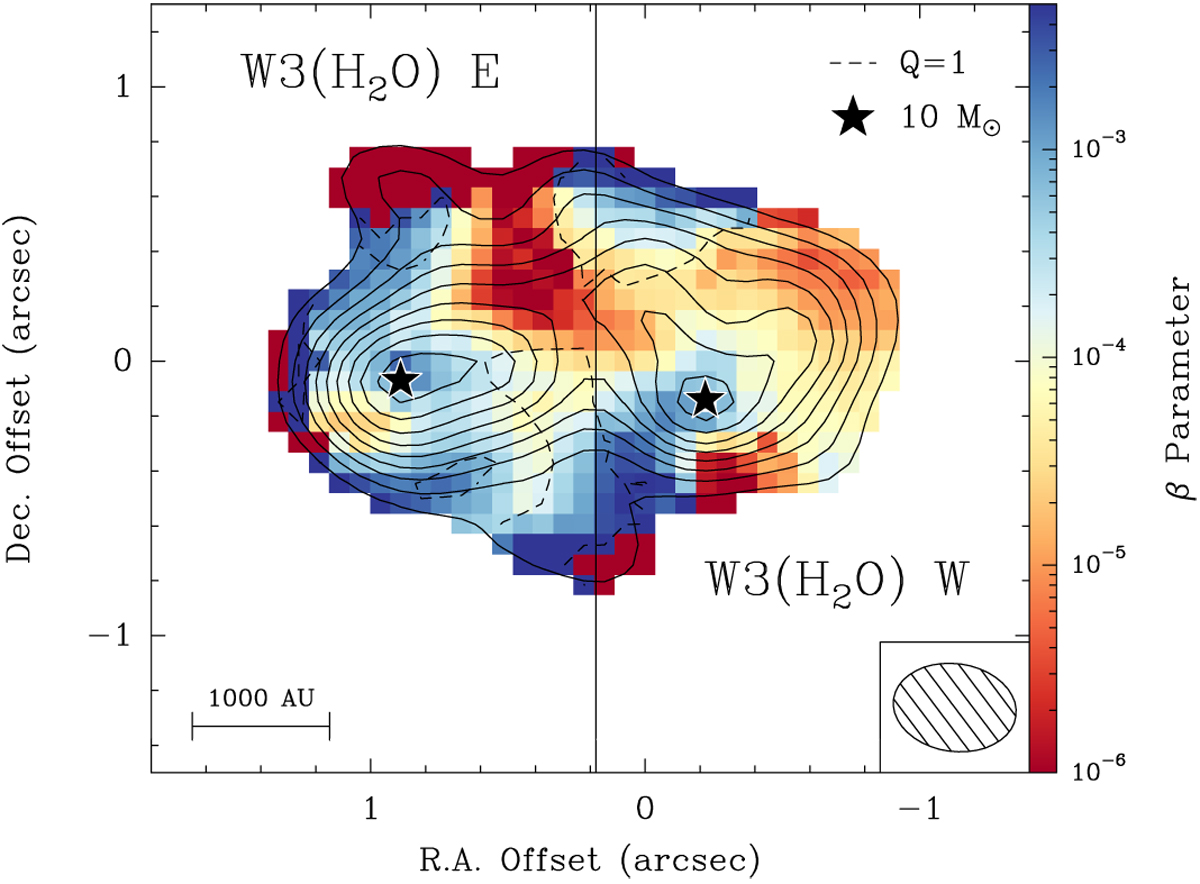
Map of β cooling parameter obtained by assuming two disk-like structures in gravito-centrifugal rotation about the positions of peak continuum emission as depicted by stars. The solid contours correspond to our continuum data in the most extended configuration, starting at 6σ and increasing in steps of 3σ (1σ = 2.5 mJy beam−1). The solid vertical line corresponds to the stitching boundary. The dashed line corresponds to Toomre Q = 1. Regions outside of the 6σ mm continuum emission contour in the AB configuration are masked out.
Current usage metrics show cumulative count of Article Views (full-text article views including HTML views, PDF and ePub downloads, according to the available data) and Abstracts Views on Vision4Press platform.
Data correspond to usage on the plateform after 2015. The current usage metrics is available 48-96 hours after online publication and is updated daily on week days.
Initial download of the metrics may take a while.