Fig. 11
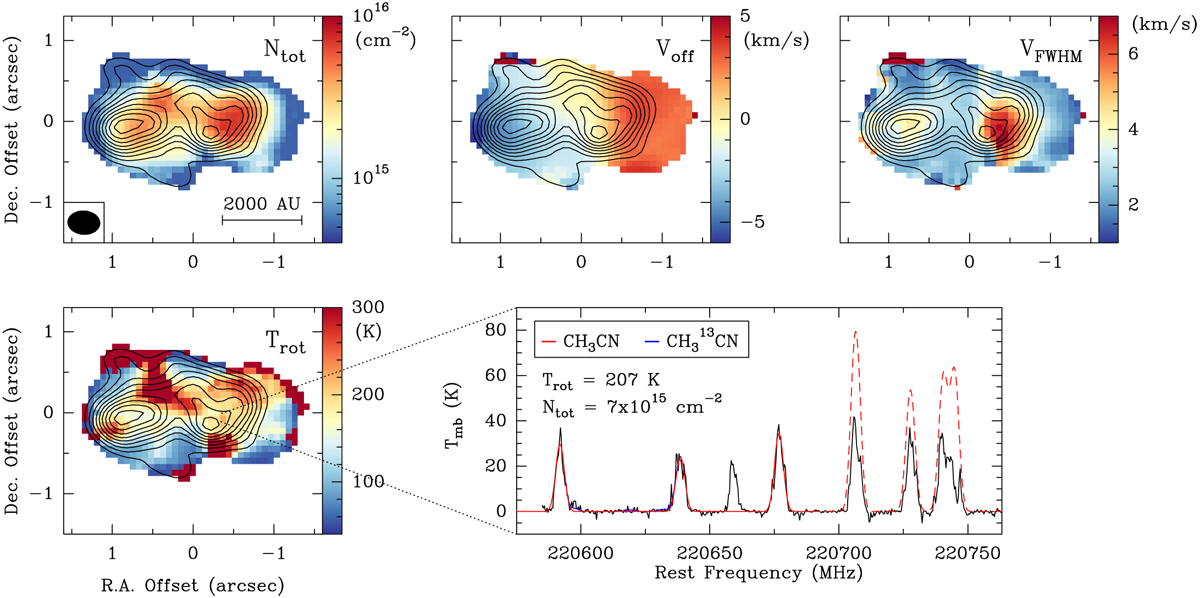
Column density (top left panel), velocity offset (top middle panel), full width at half maximum linewidth (top right panel), and rotational temperature (bottom left panel) maps obtained by fitting CH3CN (12K−11K), K = 4−6 and ![]() lines simultaneously with XCLASS. The black contours correspond to the continuum image in the AB configuration, start at
6σ
and increase in steps of 3σ
(see Table 4). Bottom right panel: observed spectrum of a given pixel drawn in black and overlaid with the resulting fit for CH3CN (12K−11K), K = 4−6 in red and the marginally detected
lines simultaneously with XCLASS. The black contours correspond to the continuum image in the AB configuration, start at
6σ
and increase in steps of 3σ
(see Table 4). Bottom right panel: observed spectrum of a given pixel drawn in black and overlaid with the resulting fit for CH3CN (12K−11K), K = 4−6 in red and the marginally detected ![]() in blue. The dashed red line corresponds to the predicted fit for the CH3CN lines that were not used in the fitting process (see explanation in Appendix B). The bright line detected between
K = 4 and 5 components is identified as C2H5CN. The corresponding fit parameters are provided in the panel. Regions outside of the most extended combination of 6σ
contours of integrated intensity of CH3CN lines are masked out.
in blue. The dashed red line corresponds to the predicted fit for the CH3CN lines that were not used in the fitting process (see explanation in Appendix B). The bright line detected between
K = 4 and 5 components is identified as C2H5CN. The corresponding fit parameters are provided in the panel. Regions outside of the most extended combination of 6σ
contours of integrated intensity of CH3CN lines are masked out.
Current usage metrics show cumulative count of Article Views (full-text article views including HTML views, PDF and ePub downloads, according to the available data) and Abstracts Views on Vision4Press platform.
Data correspond to usage on the plateform after 2015. The current usage metrics is available 48-96 hours after online publication and is updated daily on week days.
Initial download of the metrics may take a while.