Fig. 10
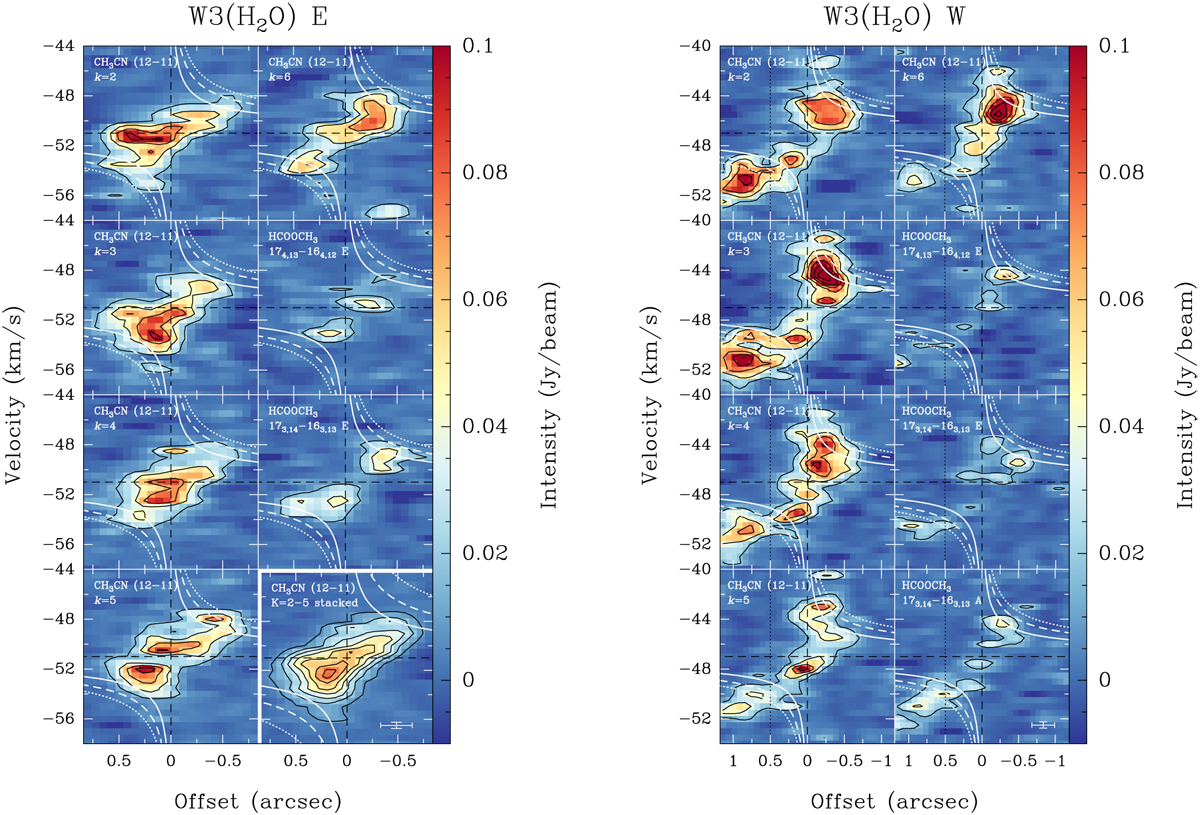
Position–velocity plots along a cut in the direction of rotation as depicted by dashed lines in Fig. 9 for a fragment to the east (left panel) and to the west (right panel). The black contours start at 4σ and increase in steps of 6σ. The white solid, dashed, and dotted lines correspond to the region within which emission is expected if the gas is in a disk in Keplerian rotation about a 5, 10, and 15 M⊙ star, respectively. The crosses in the bottom right corners correspond to the spatial and spectral resolutions. Regions to the left of the dotted vertical line in the right figure contain contributions from W3(H2O) E.
Current usage metrics show cumulative count of Article Views (full-text article views including HTML views, PDF and ePub downloads, according to the available data) and Abstracts Views on Vision4Press platform.
Data correspond to usage on the plateform after 2015. The current usage metrics is available 48-96 hours after online publication and is updated daily on week days.
Initial download of the metrics may take a while.