Fig. 1
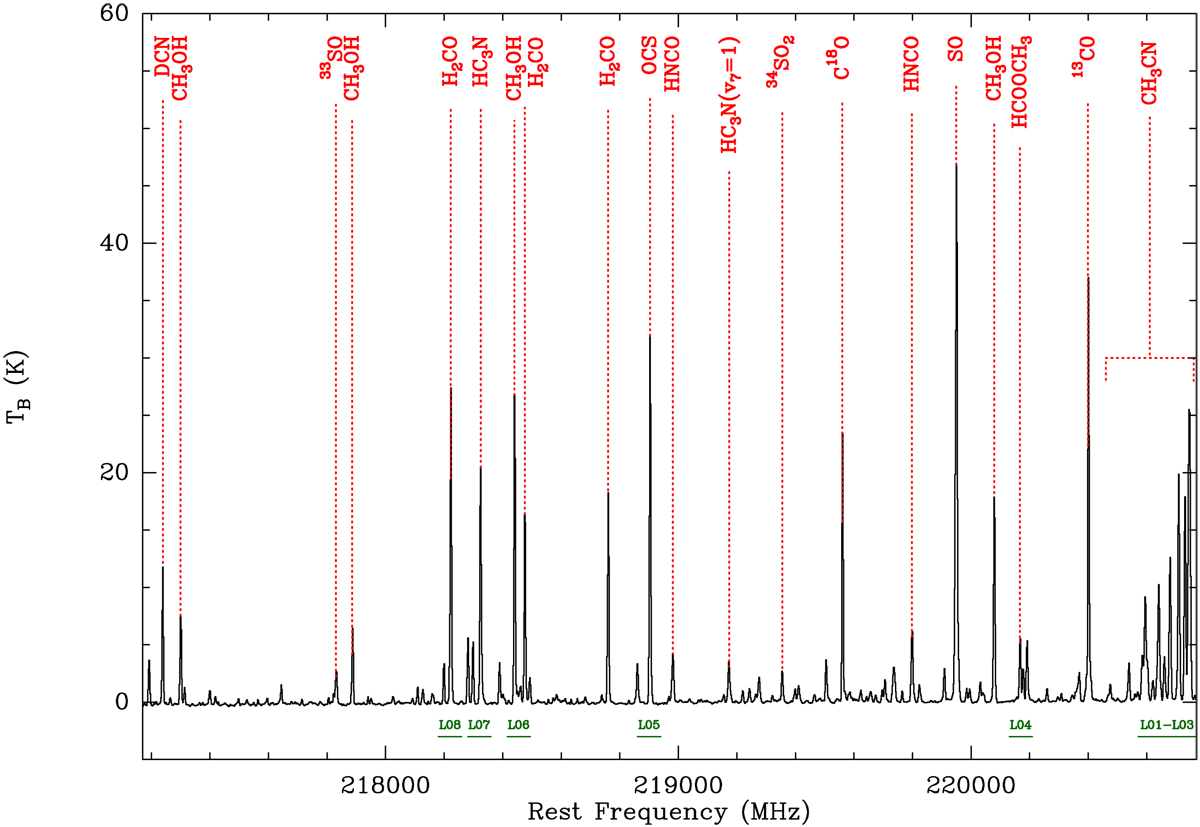
Full WideX spectrum of W3(H2O) averaged over a 4′′ × 4′′ region encompassing two cores, W3(H2O) E and W3(H2O) W, showing the chemical richness of the source. The coverage of the narrow-band correlator units are shown as horizontal green lines and labelled accordingly. The units of the spectrum have been converted from Jy beam−1 to K by multiplying the flux by 188 K Jy−1 under the Rayleigh–Jeans approximation.
Current usage metrics show cumulative count of Article Views (full-text article views including HTML views, PDF and ePub downloads, according to the available data) and Abstracts Views on Vision4Press platform.
Data correspond to usage on the plateform after 2015. The current usage metrics is available 48-96 hours after online publication and is updated daily on week days.
Initial download of the metrics may take a while.