Free Access
Fig. A.2.
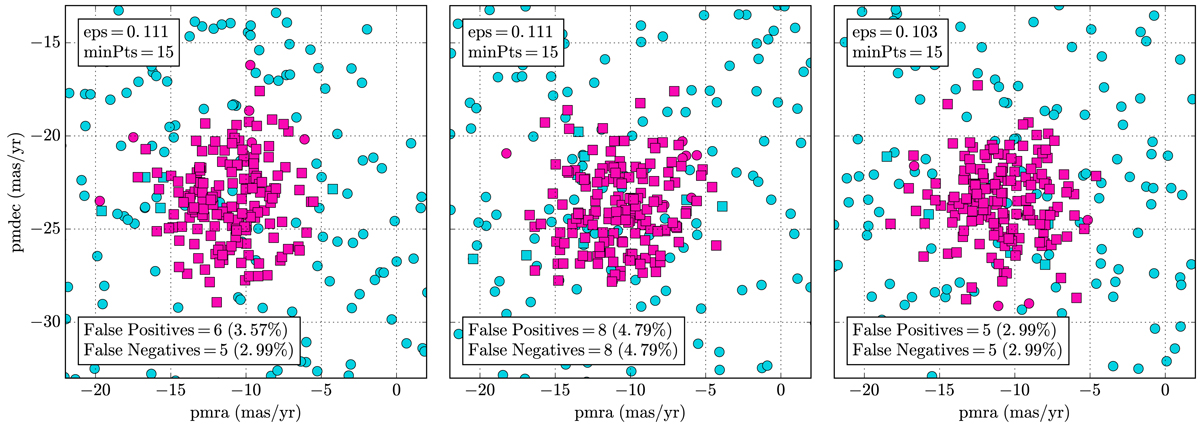
Proper motion plots showing the results of DBSCAN performed on three samples of data simulated with the Gaussian method. True cluster members are represented by squares, and true background objects by circles. Objects selected by DBSCAN are shown in pink.
Current usage metrics show cumulative count of Article Views (full-text article views including HTML views, PDF and ePub downloads, according to the available data) and Abstracts Views on Vision4Press platform.
Data correspond to usage on the plateform after 2015. The current usage metrics is available 48-96 hours after online publication and is updated daily on week days.
Initial download of the metrics may take a while.