Open Access
Fig. A.1.
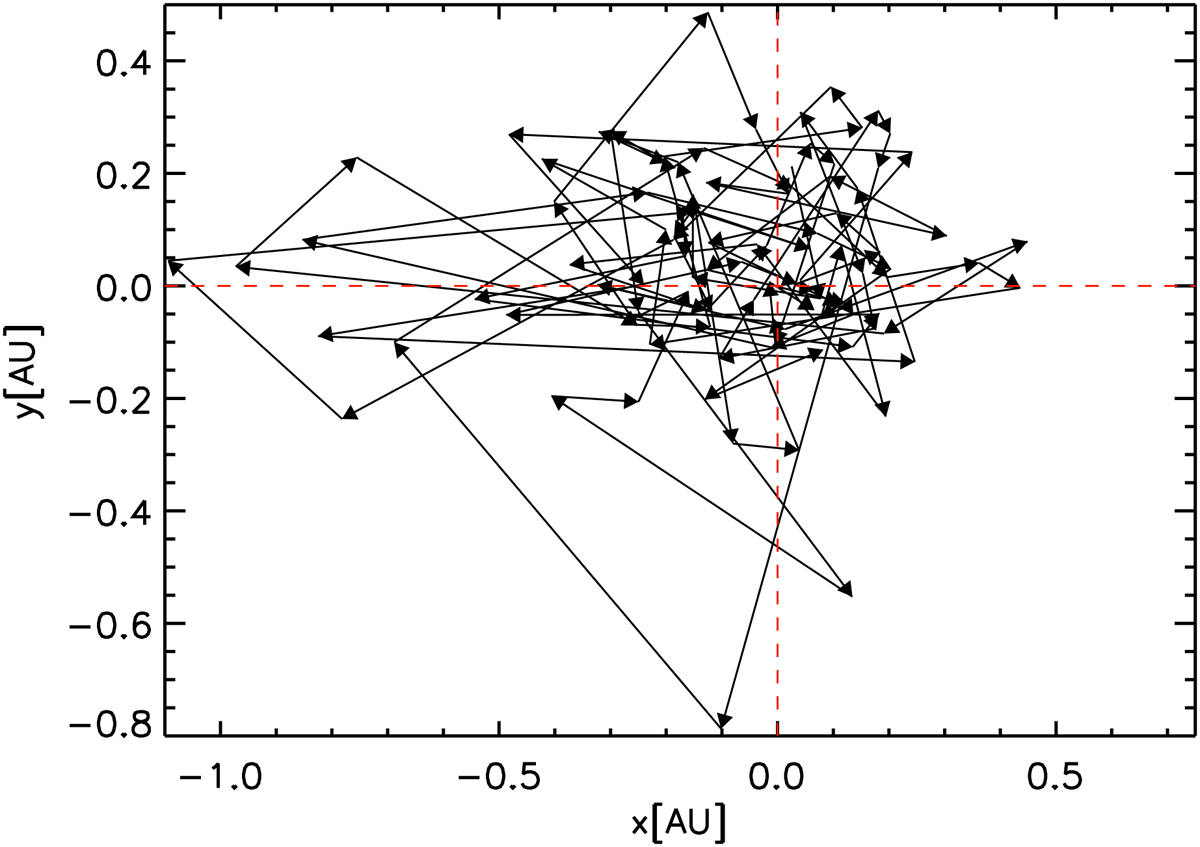
Photocentre position computed from RHD simulation st26gm07n001 in Table 1 in the Gaia G band filter. The different snapshots are connected by the line segments; the total time covered is reported in the Table. The dashed lines intersect at the position of the geometrical centre of the images.
Current usage metrics show cumulative count of Article Views (full-text article views including HTML views, PDF and ePub downloads, according to the available data) and Abstracts Views on Vision4Press platform.
Data correspond to usage on the plateform after 2015. The current usage metrics is available 48-96 hours after online publication and is updated daily on week days.
Initial download of the metrics may take a while.