Open Access
Fig. 1.
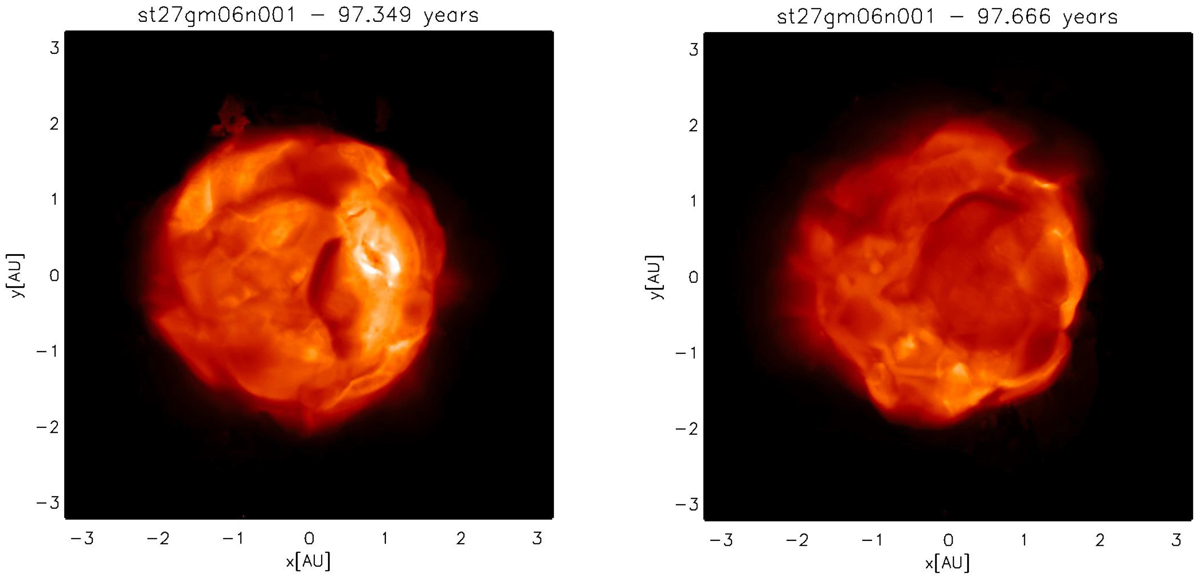
Example of the squared root intensity maps (the range is![]() erg s−1 cm−2 Å−1) in the Gaia G photometric system (Evans et al. 2018) for two different snapshots of one simulation listed in Table 1. The number on the top indicates the stellar times at which the two snapshots were computed.
erg s−1 cm−2 Å−1) in the Gaia G photometric system (Evans et al. 2018) for two different snapshots of one simulation listed in Table 1. The number on the top indicates the stellar times at which the two snapshots were computed.
Current usage metrics show cumulative count of Article Views (full-text article views including HTML views, PDF and ePub downloads, according to the available data) and Abstracts Views on Vision4Press platform.
Data correspond to usage on the plateform after 2015. The current usage metrics is available 48-96 hours after online publication and is updated daily on week days.
Initial download of the metrics may take a while.