Fig. 1.
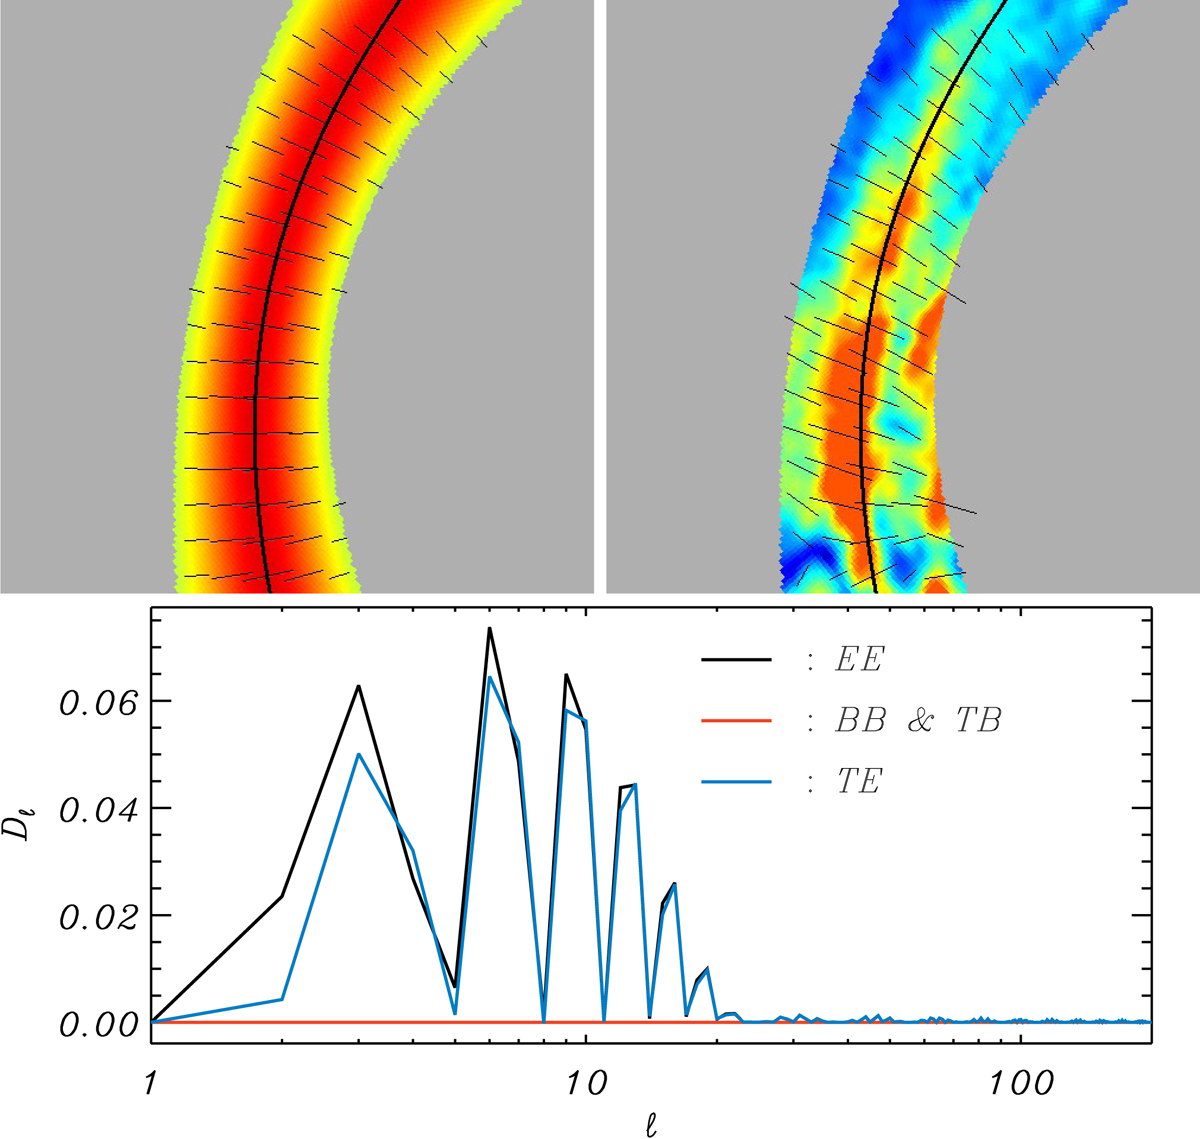
Upper left: example of the expected loop polarization directions (by small black lines). Upper right: polarization directions of the WMAP K-band in the Loop I region, with Loop I marked by a black circle. The color scales of the upper panels are for the polarized intensity, which is 0 ~100 μK for the K-band and −1 ~ 1.2 for the model (here the absolute amplitude of polarization intensity is meaningless for the model, and therefore such an unphysical range is chosen to maximize the visibility of the thin lines). Lower: the angular power spectrum of the model shown in upper-left, calculated without a mask. We note that the polarization directions in the model are strictly along the normal vectors, and some small misalignments are only visual effects due to pixelization.
Current usage metrics show cumulative count of Article Views (full-text article views including HTML views, PDF and ePub downloads, according to the available data) and Abstracts Views on Vision4Press platform.
Data correspond to usage on the plateform after 2015. The current usage metrics is available 48-96 hours after online publication and is updated daily on week days.
Initial download of the metrics may take a while.