Free Access
Fig. 7.
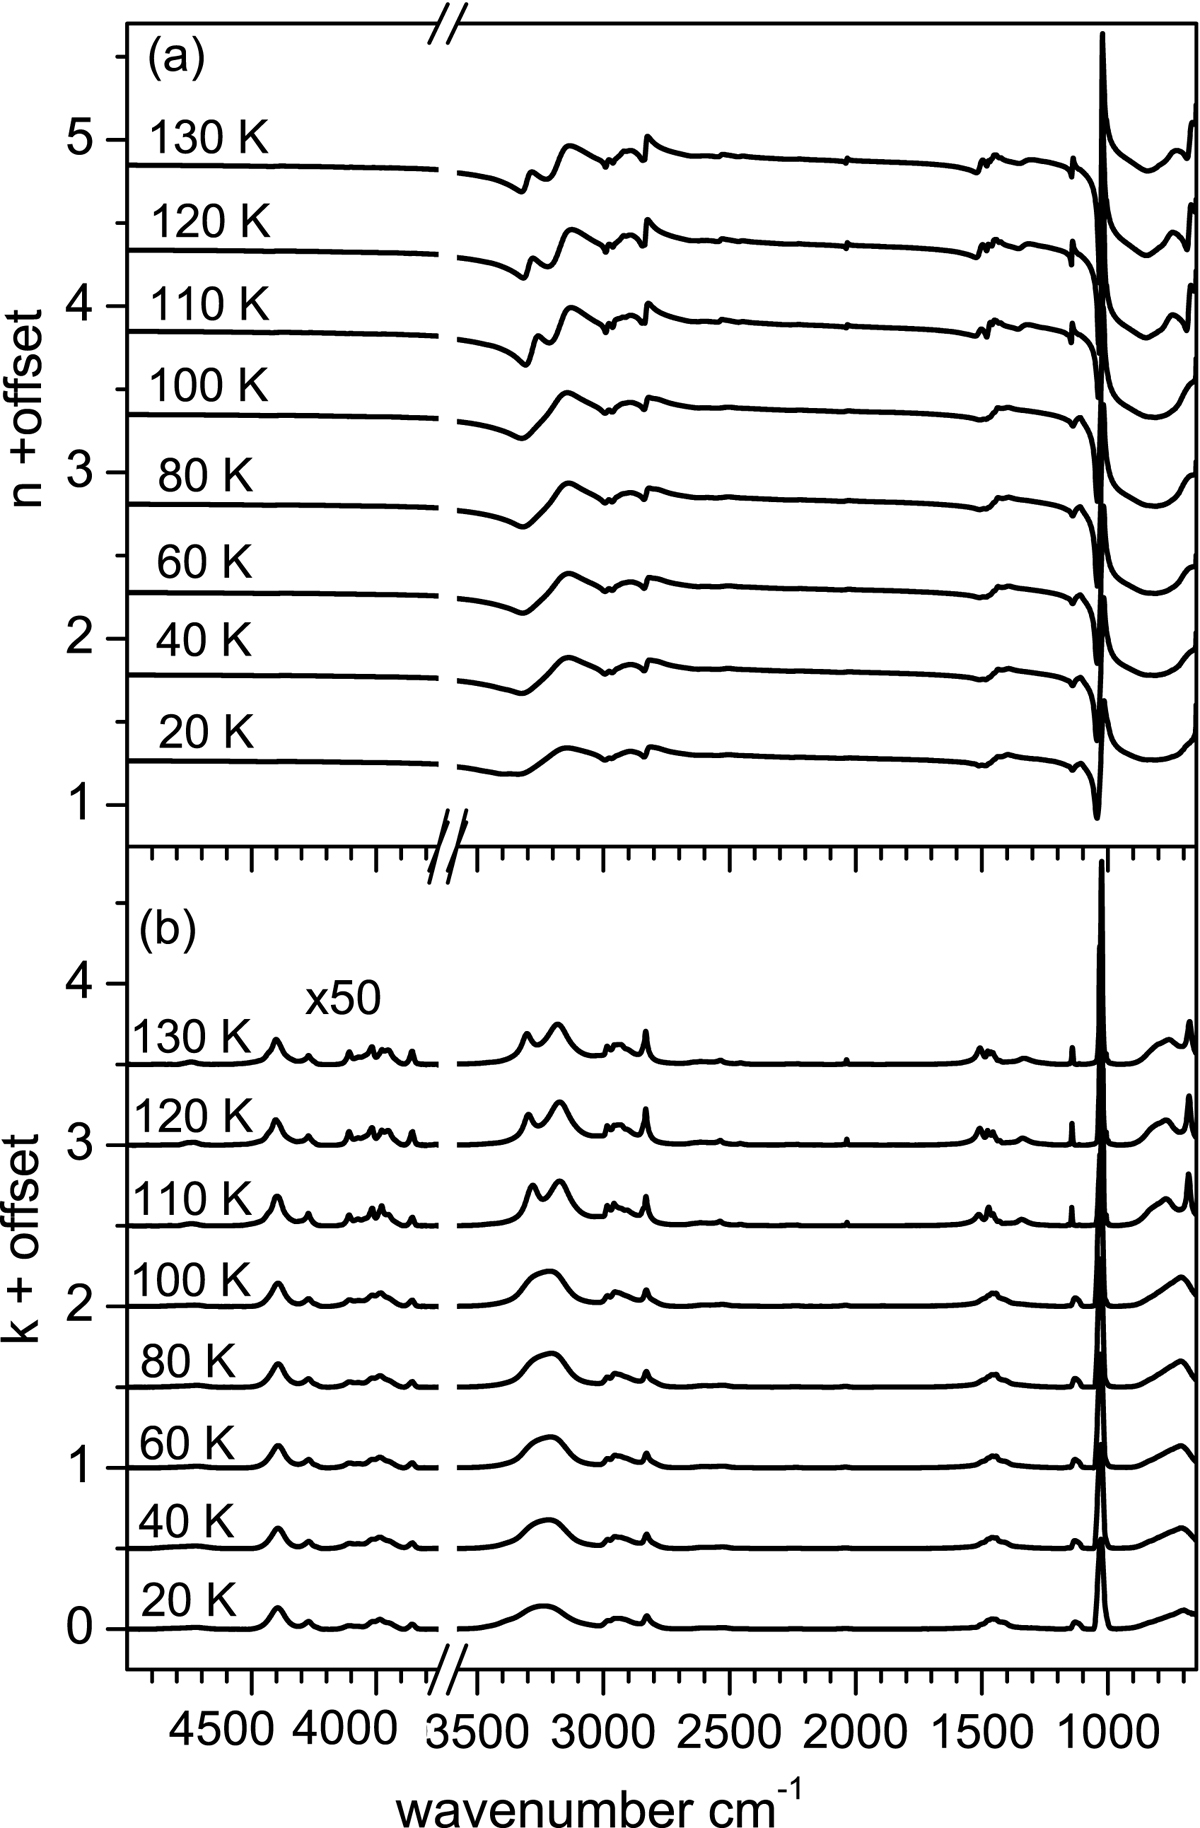
Infrared real (n) and imaginary (k) part of the refractive index of methanol ices at different deposition temperatures. Vertical offsets have been added to the magnitudes for clarity in the representation. In the lower panel, k multiplied by 50 has been represented in the 3700 and 5000 cm−1 spectral range.
Current usage metrics show cumulative count of Article Views (full-text article views including HTML views, PDF and ePub downloads, according to the available data) and Abstracts Views on Vision4Press platform.
Data correspond to usage on the plateform after 2015. The current usage metrics is available 48-96 hours after online publication and is updated daily on week days.
Initial download of the metrics may take a while.