Fig. 5.
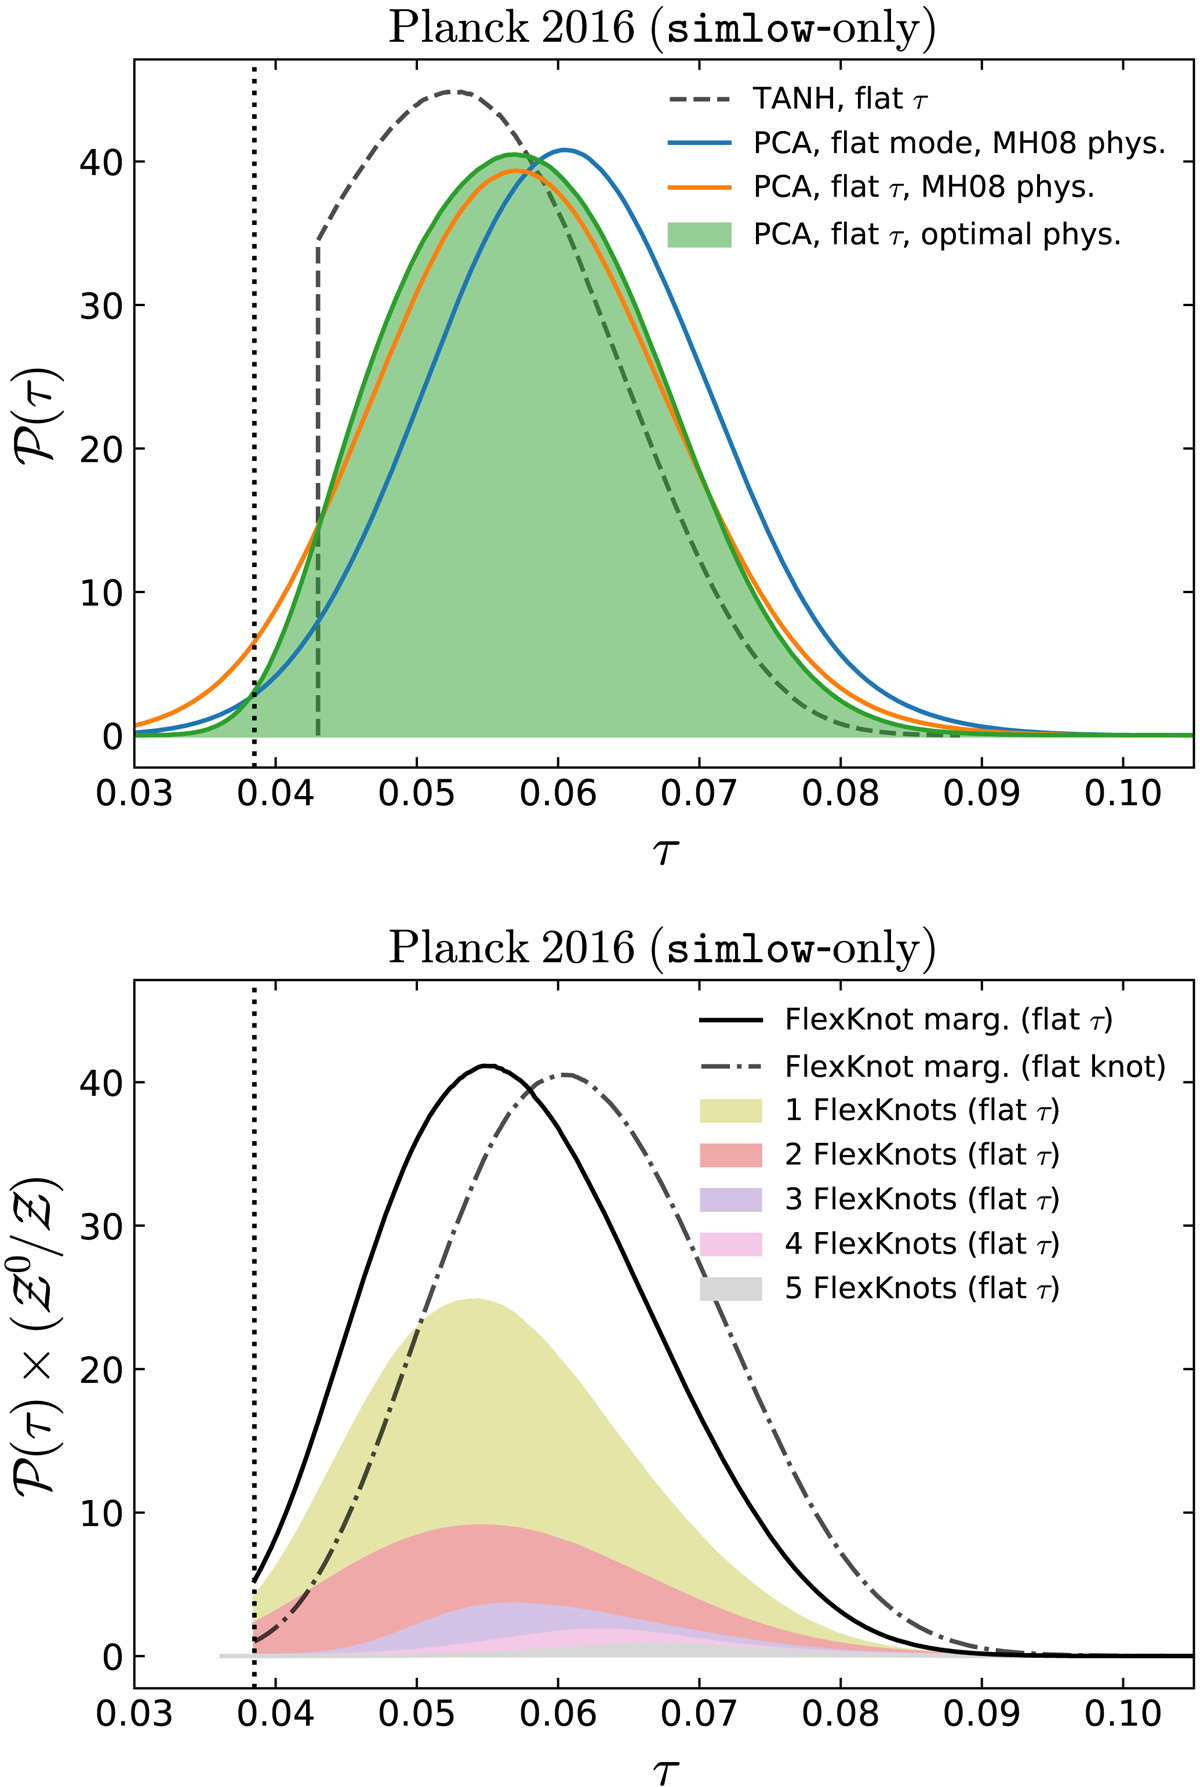
Constraints on the total optical depth when using the Planck intermediate simlow likelihood alone. Various reionization models and priors are used (labeled in each plot), with other ΛCDM parameters fixed to their best-fit values from PlanckTT data. In the bottom panel, the height of each FlexKnot model is proportional to its Bayesian evidence, with an overall scaling so that their sum (the black curve) gives a properly normalized probability distribution. This curve corresponds to marginalization over the number of FlexKnot to use.
Current usage metrics show cumulative count of Article Views (full-text article views including HTML views, PDF and ePub downloads, according to the available data) and Abstracts Views on Vision4Press platform.
Data correspond to usage on the plateform after 2015. The current usage metrics is available 48-96 hours after online publication and is updated daily on week days.
Initial download of the metrics may take a while.