Fig. 3.
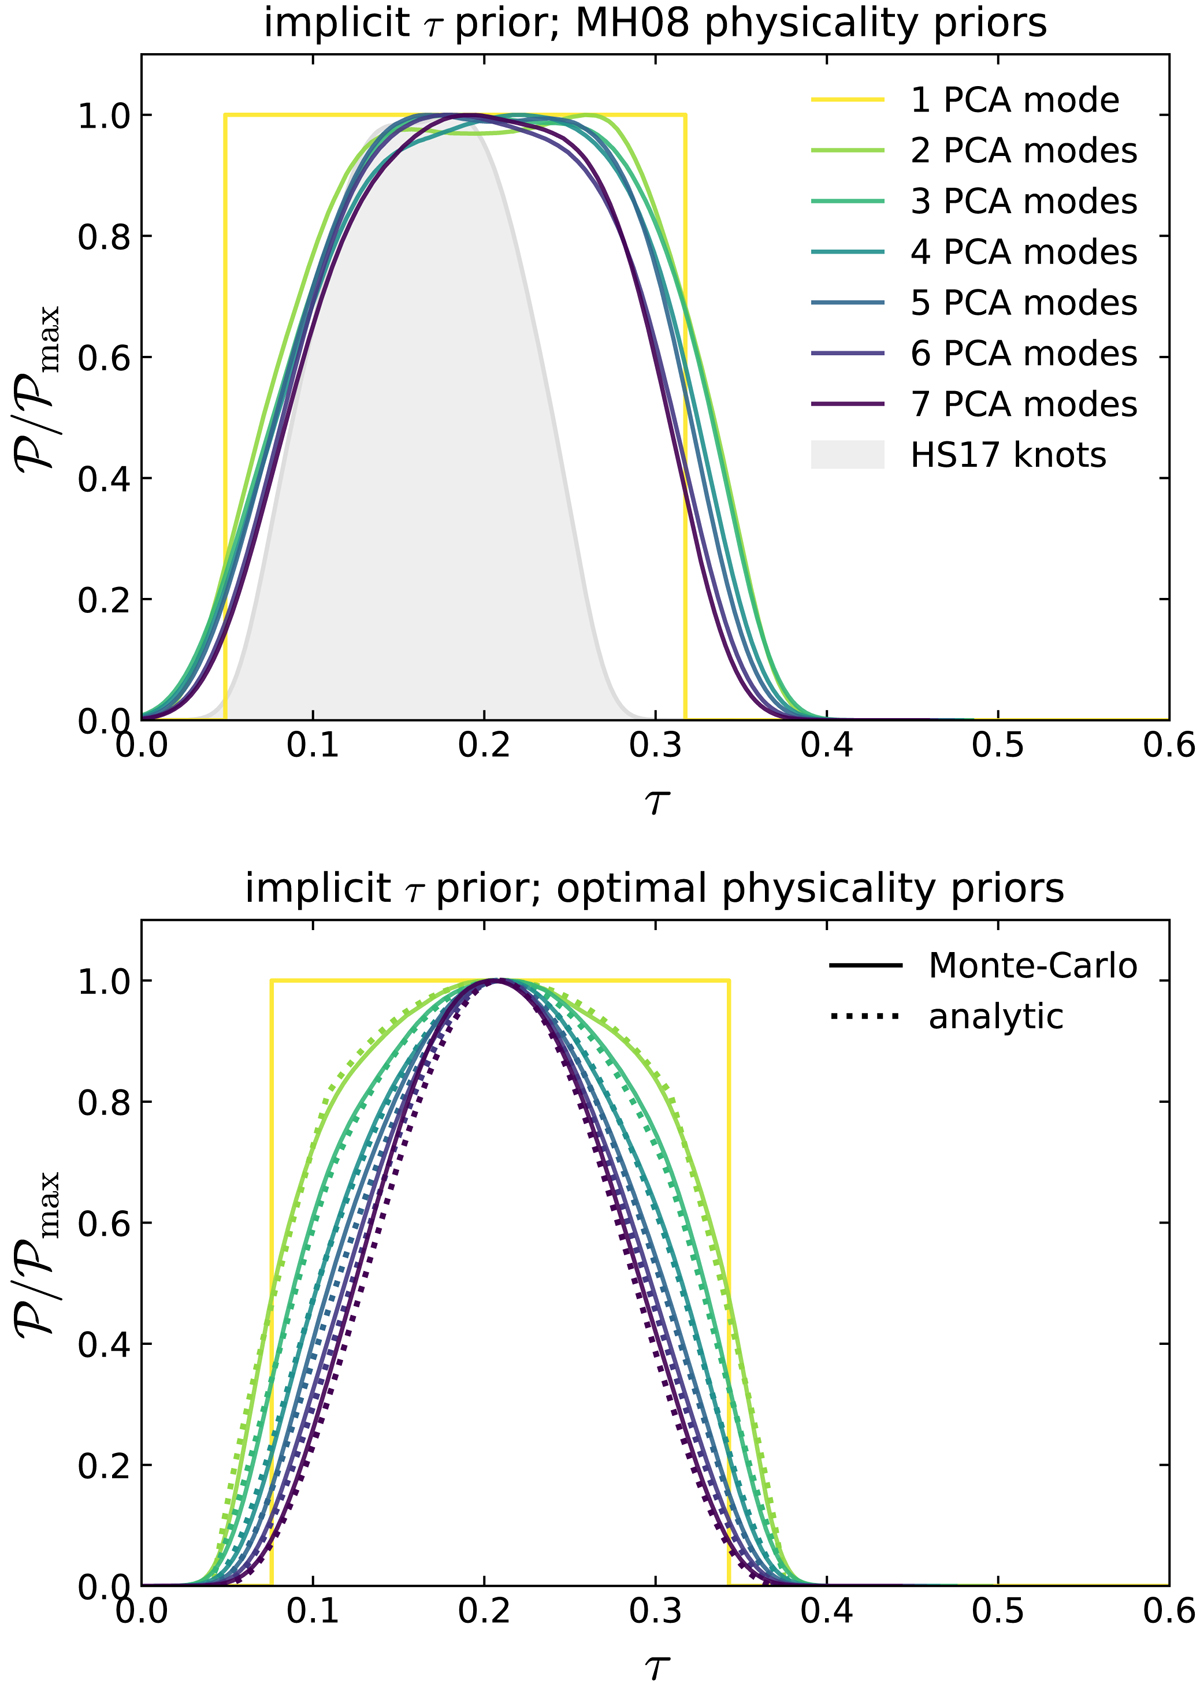
Solid colored lines: implicit prior on τ from the PCA model when taking a flat prior on the mode amplitudes, computed via Monte Carlo. The top panel assumes the MH08 physicality region, whereas the bottom panel assumes our optimal physicality region. In the case of the bottom panel, analytic calculation of the prior is possible via Eq. (15) and shown as dotted lines. The top panel also shows the implicit prior for the HS17 model.
Current usage metrics show cumulative count of Article Views (full-text article views including HTML views, PDF and ePub downloads, according to the available data) and Abstracts Views on Vision4Press platform.
Data correspond to usage on the plateform after 2015. The current usage metrics is available 48-96 hours after online publication and is updated daily on week days.
Initial download of the metrics may take a while.