Fig. 7.
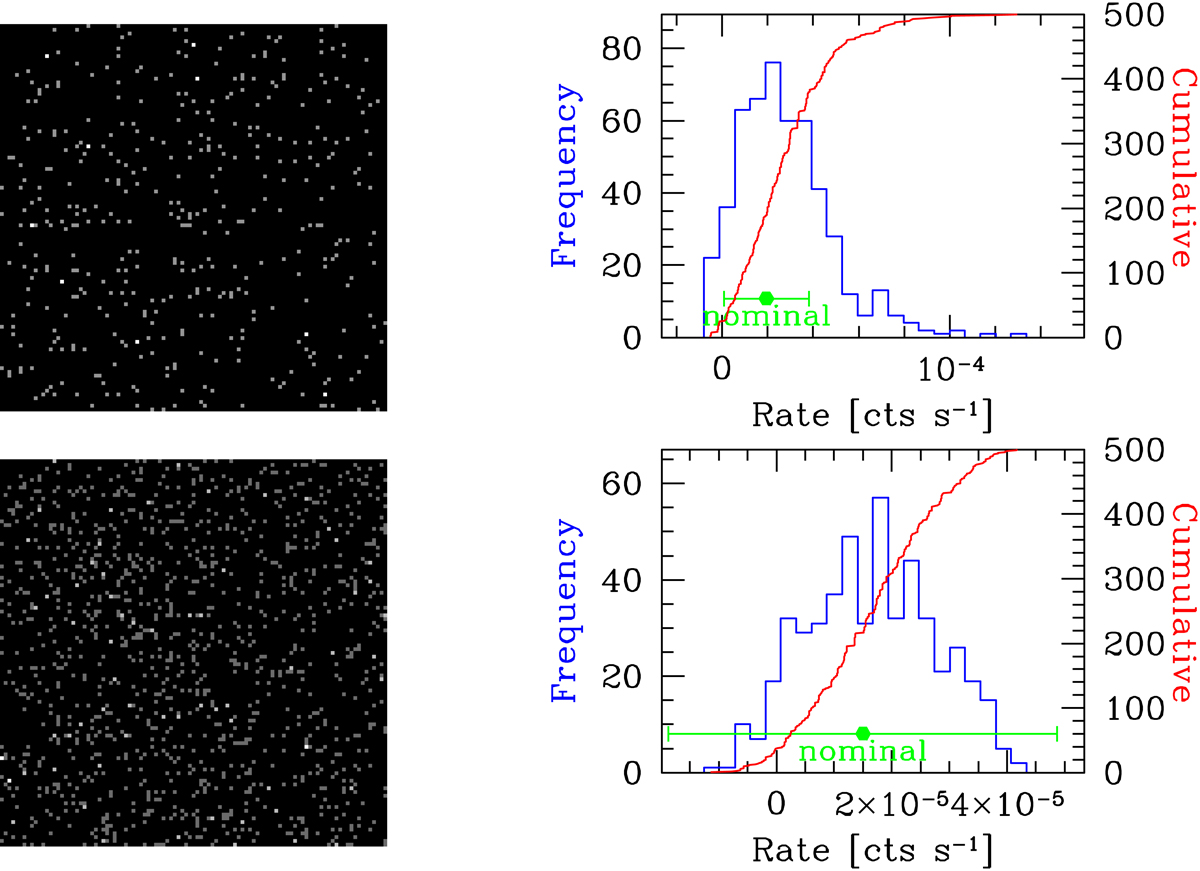
Results of the stacking analysis performed on the C-COSMOS field at the coordinates of the Capak et al. (2015) high-z galaxies given by Barišić et al. (2017, see Table 1). Upper panels: 100″ × 100″ stacked map of the 0.5−2 keV Chandra passband (left) and corresponding count-rate histogram (right). Lower panels: the same for the 2–8 keV Chandra passband. In both histograms, the count-rate frequencies (blue histogram) are shown along their cumulative distributions (red histogram) and their nominal mean (green dot) with 1σ uncertainty.
Current usage metrics show cumulative count of Article Views (full-text article views including HTML views, PDF and ePub downloads, according to the available data) and Abstracts Views on Vision4Press platform.
Data correspond to usage on the plateform after 2015. The current usage metrics is available 48-96 hours after online publication and is updated daily on week days.
Initial download of the metrics may take a while.