Fig. 6.
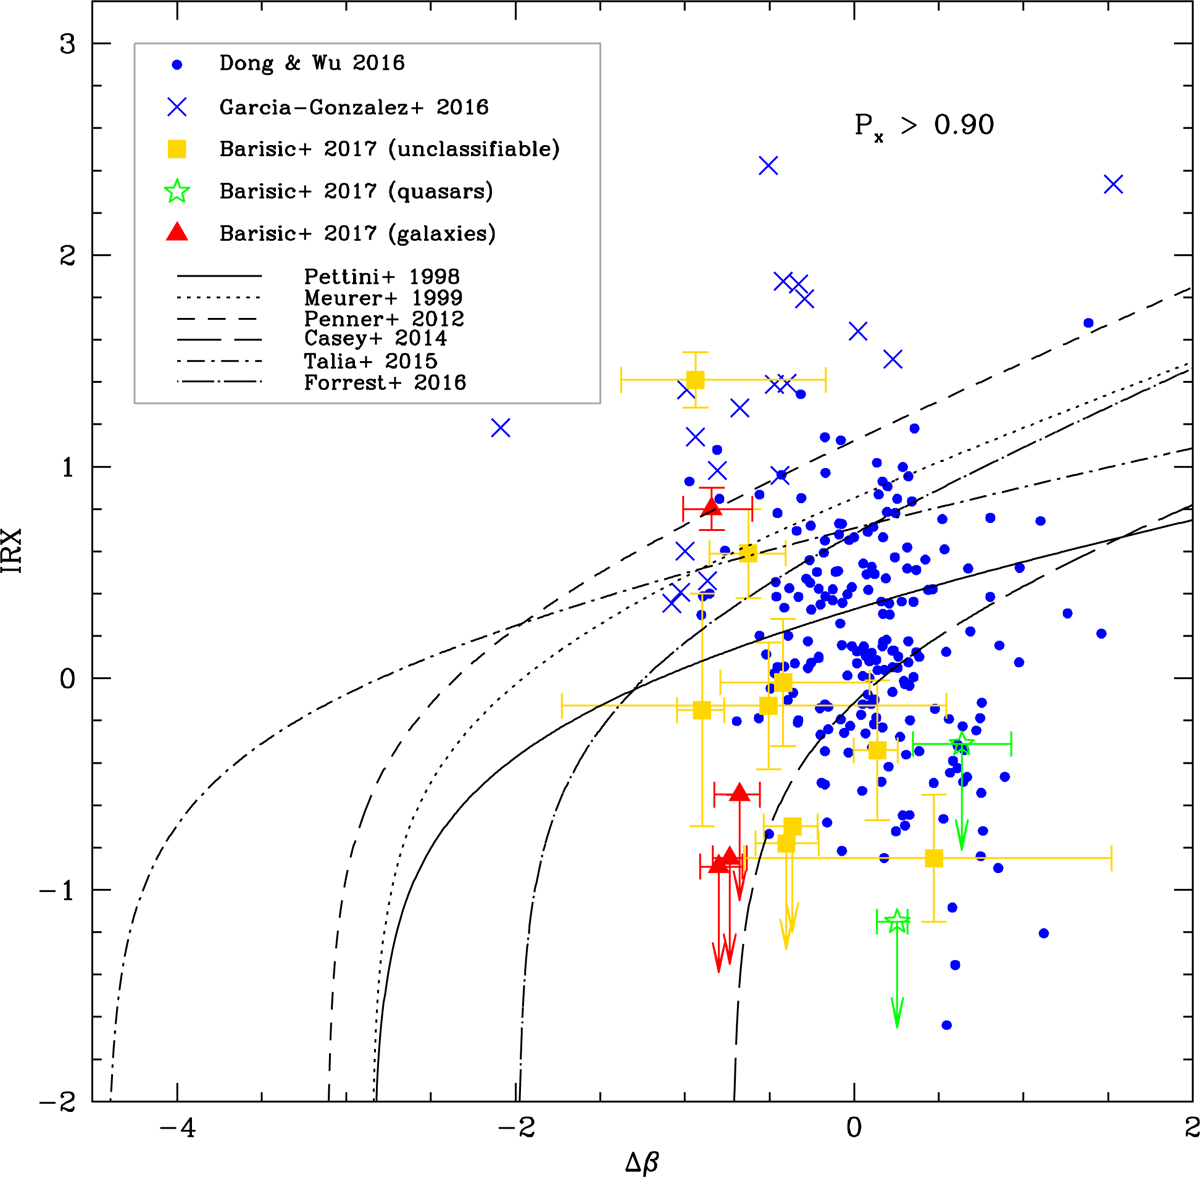
IRX as a function of the slope difference Δβ for the HerS/SDSS quasars by Dong & Wu (2016, blue dots), the Seyfert galaxies by García-González et al. (2016, blue crosses), and the high-z galaxies by Barišić et al. (2017). The high-z galaxies are classified according to the statistical analysis presented in Sect. 3 (red triangles: actual galaxies, yellow squares: unclassifiable objects, green stars: actual quasars). The curves available in the literature that describe the IRX-to-Δβ relation for various classes of galaxies (Pettini et al. 1998; Meurer et al. 1999; Penner et al. 2012; Casey et al. 2014; Talia et al. 2015; Forrest et al. 2016) are also shown.
Current usage metrics show cumulative count of Article Views (full-text article views including HTML views, PDF and ePub downloads, according to the available data) and Abstracts Views on Vision4Press platform.
Data correspond to usage on the plateform after 2015. The current usage metrics is available 48-96 hours after online publication and is updated daily on week days.
Initial download of the metrics may take a while.