Free Access
Fig. 3.
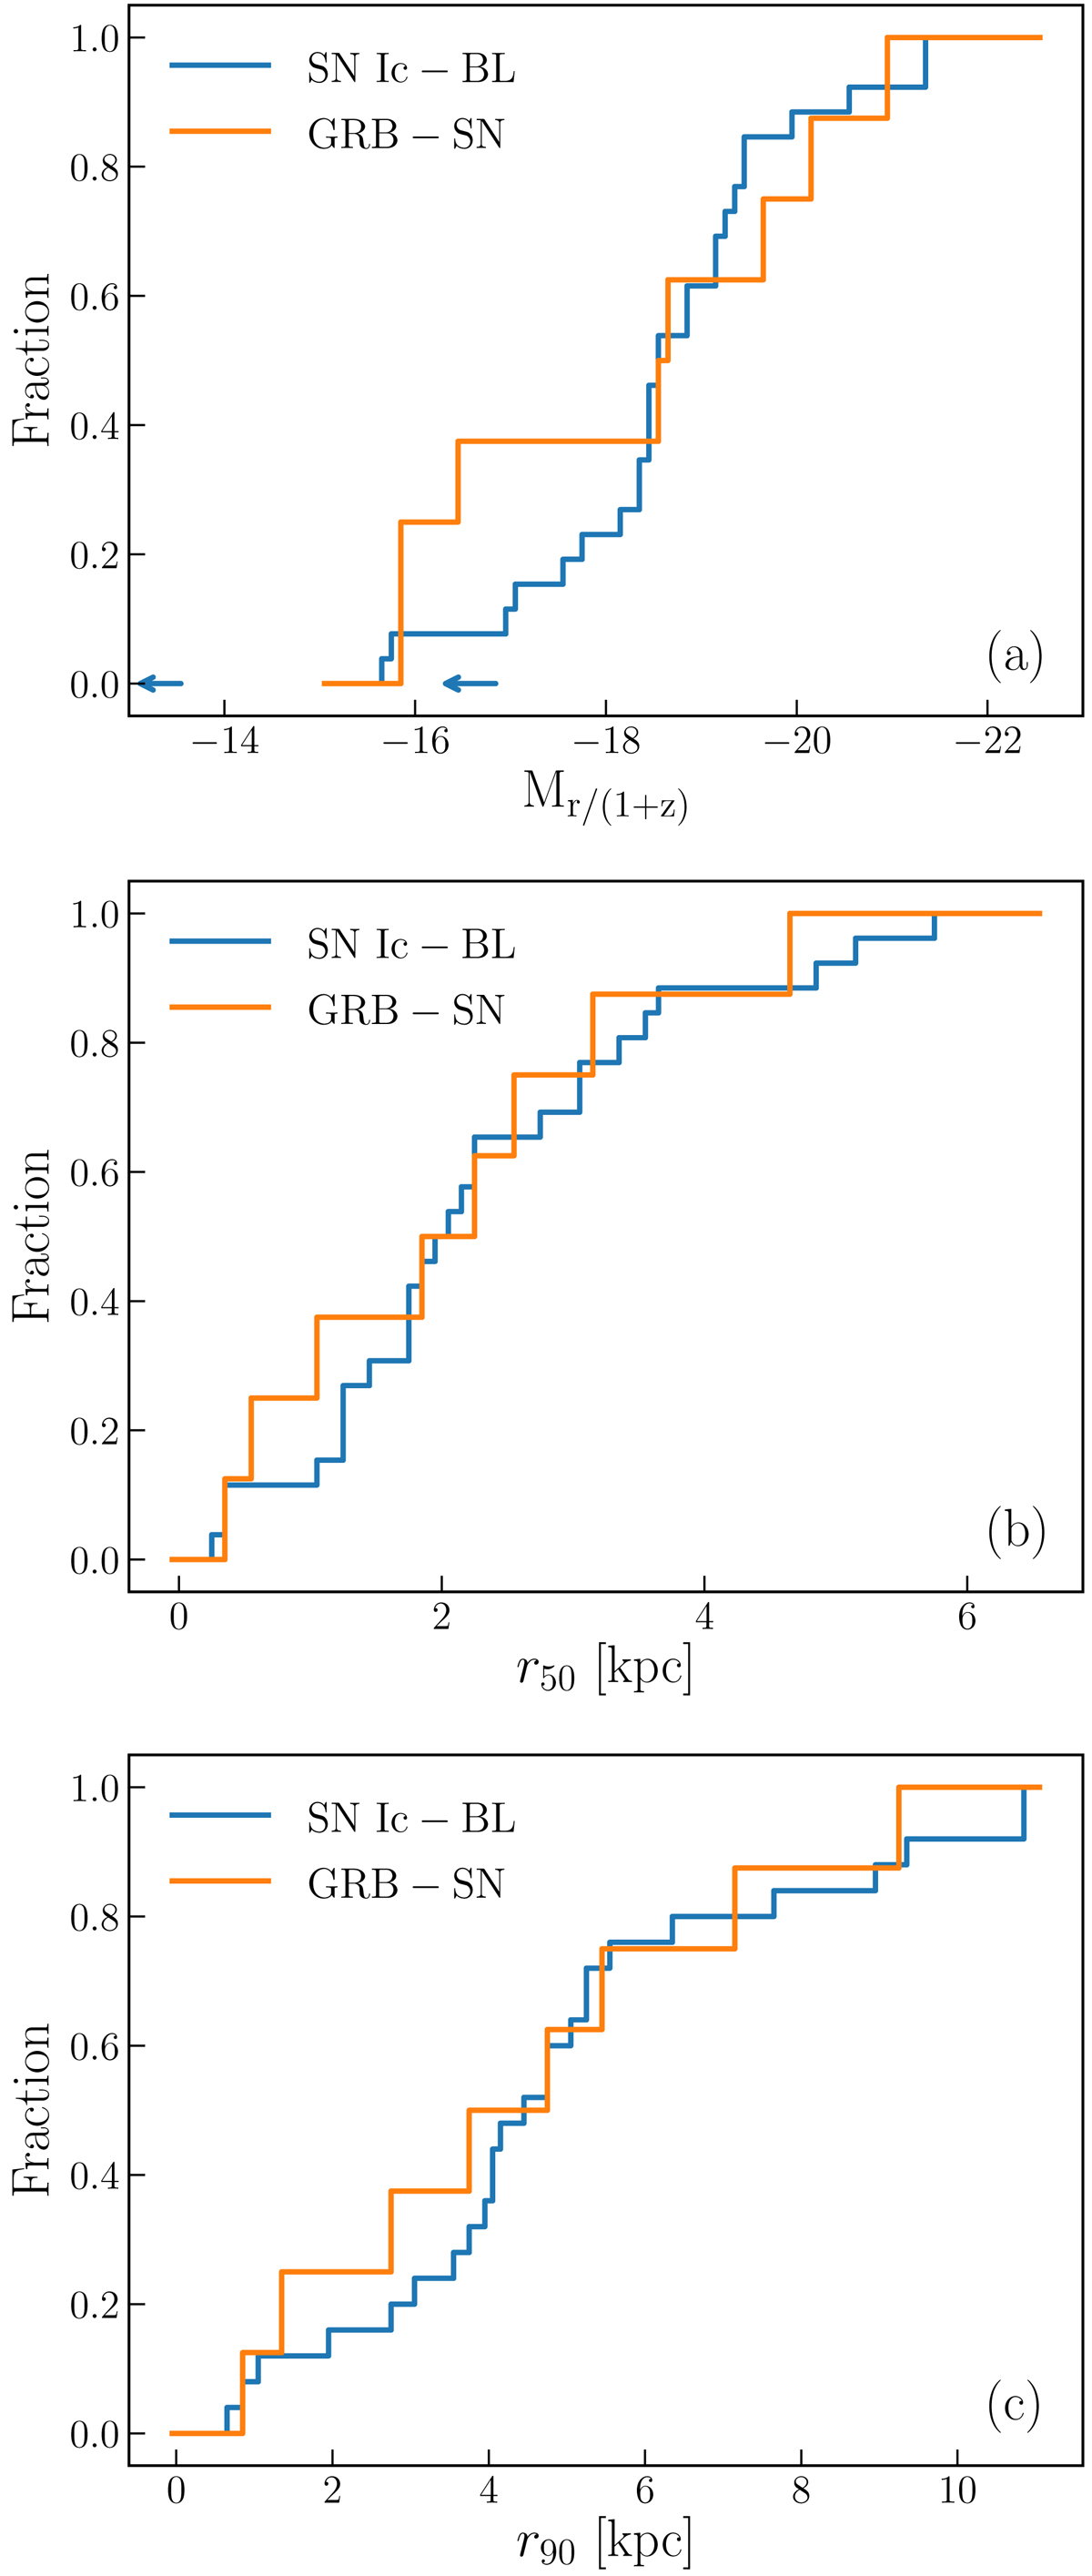
Comparing cumulative distributions of panel a: luminosity; panel b: r50 radii and panel c: r90 radii of the GRB-SN and SN Ic-BL samples. The blue arrows in figure (panel a) correspond to the upper limits measured for the hosts of SN2007bg and PTF11img.
Current usage metrics show cumulative count of Article Views (full-text article views including HTML views, PDF and ePub downloads, according to the available data) and Abstracts Views on Vision4Press platform.
Data correspond to usage on the plateform after 2015. The current usage metrics is available 48-96 hours after online publication and is updated daily on week days.
Initial download of the metrics may take a while.