Fig. 1.
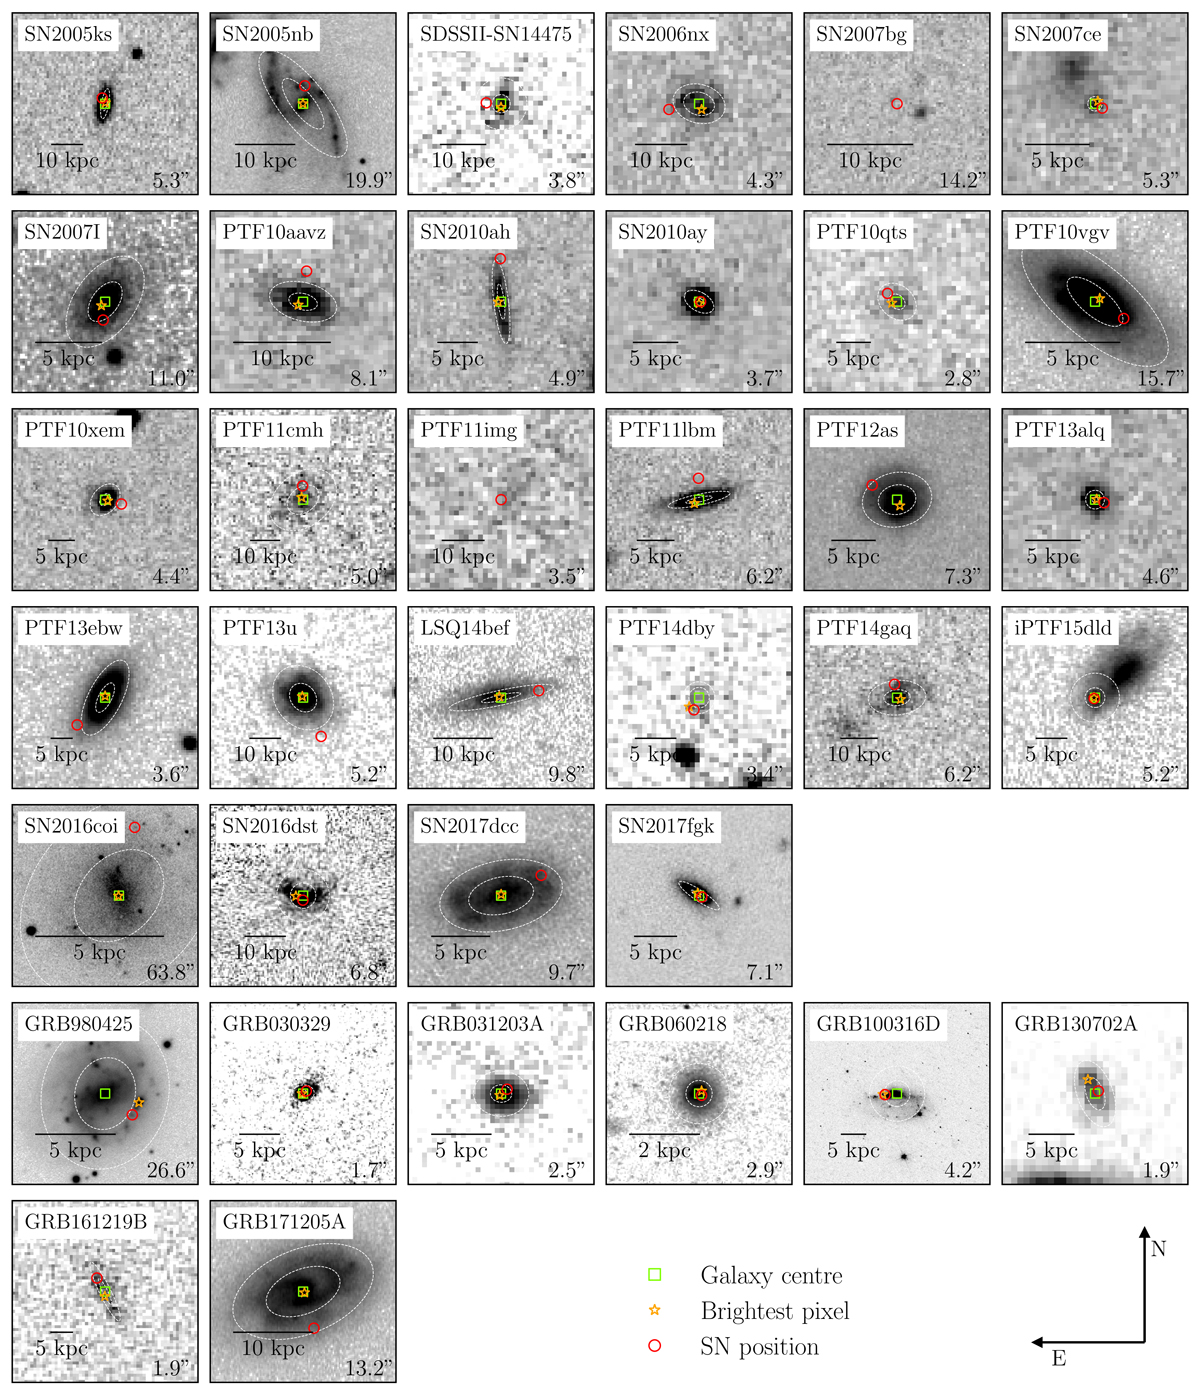
Overview of the galaxies in the sample. See Table 1 for the information on the survey or the instrument with which each image has been taken. The red circle indicates the position of each SN: the size of the circle is arbitrary. The green square and the orange star indicate the measured galaxy centre and the brightest pixel in the galaxy, respectively. Overplotted are ellipses corresponding to the measured r50 and r90 radii, where the values of position angle and inclination (see Table A.1) have been used to take geometric effects into account. The values provided in the bottom right corners correspond to the physical scales in each figure. All images are centred on galaxy centres except for the case of SN2016coi. We note that in the case of PTF11img the host galaxy is not detected.
Current usage metrics show cumulative count of Article Views (full-text article views including HTML views, PDF and ePub downloads, according to the available data) and Abstracts Views on Vision4Press platform.
Data correspond to usage on the plateform after 2015. The current usage metrics is available 48-96 hours after online publication and is updated daily on week days.
Initial download of the metrics may take a while.