Fig. 6
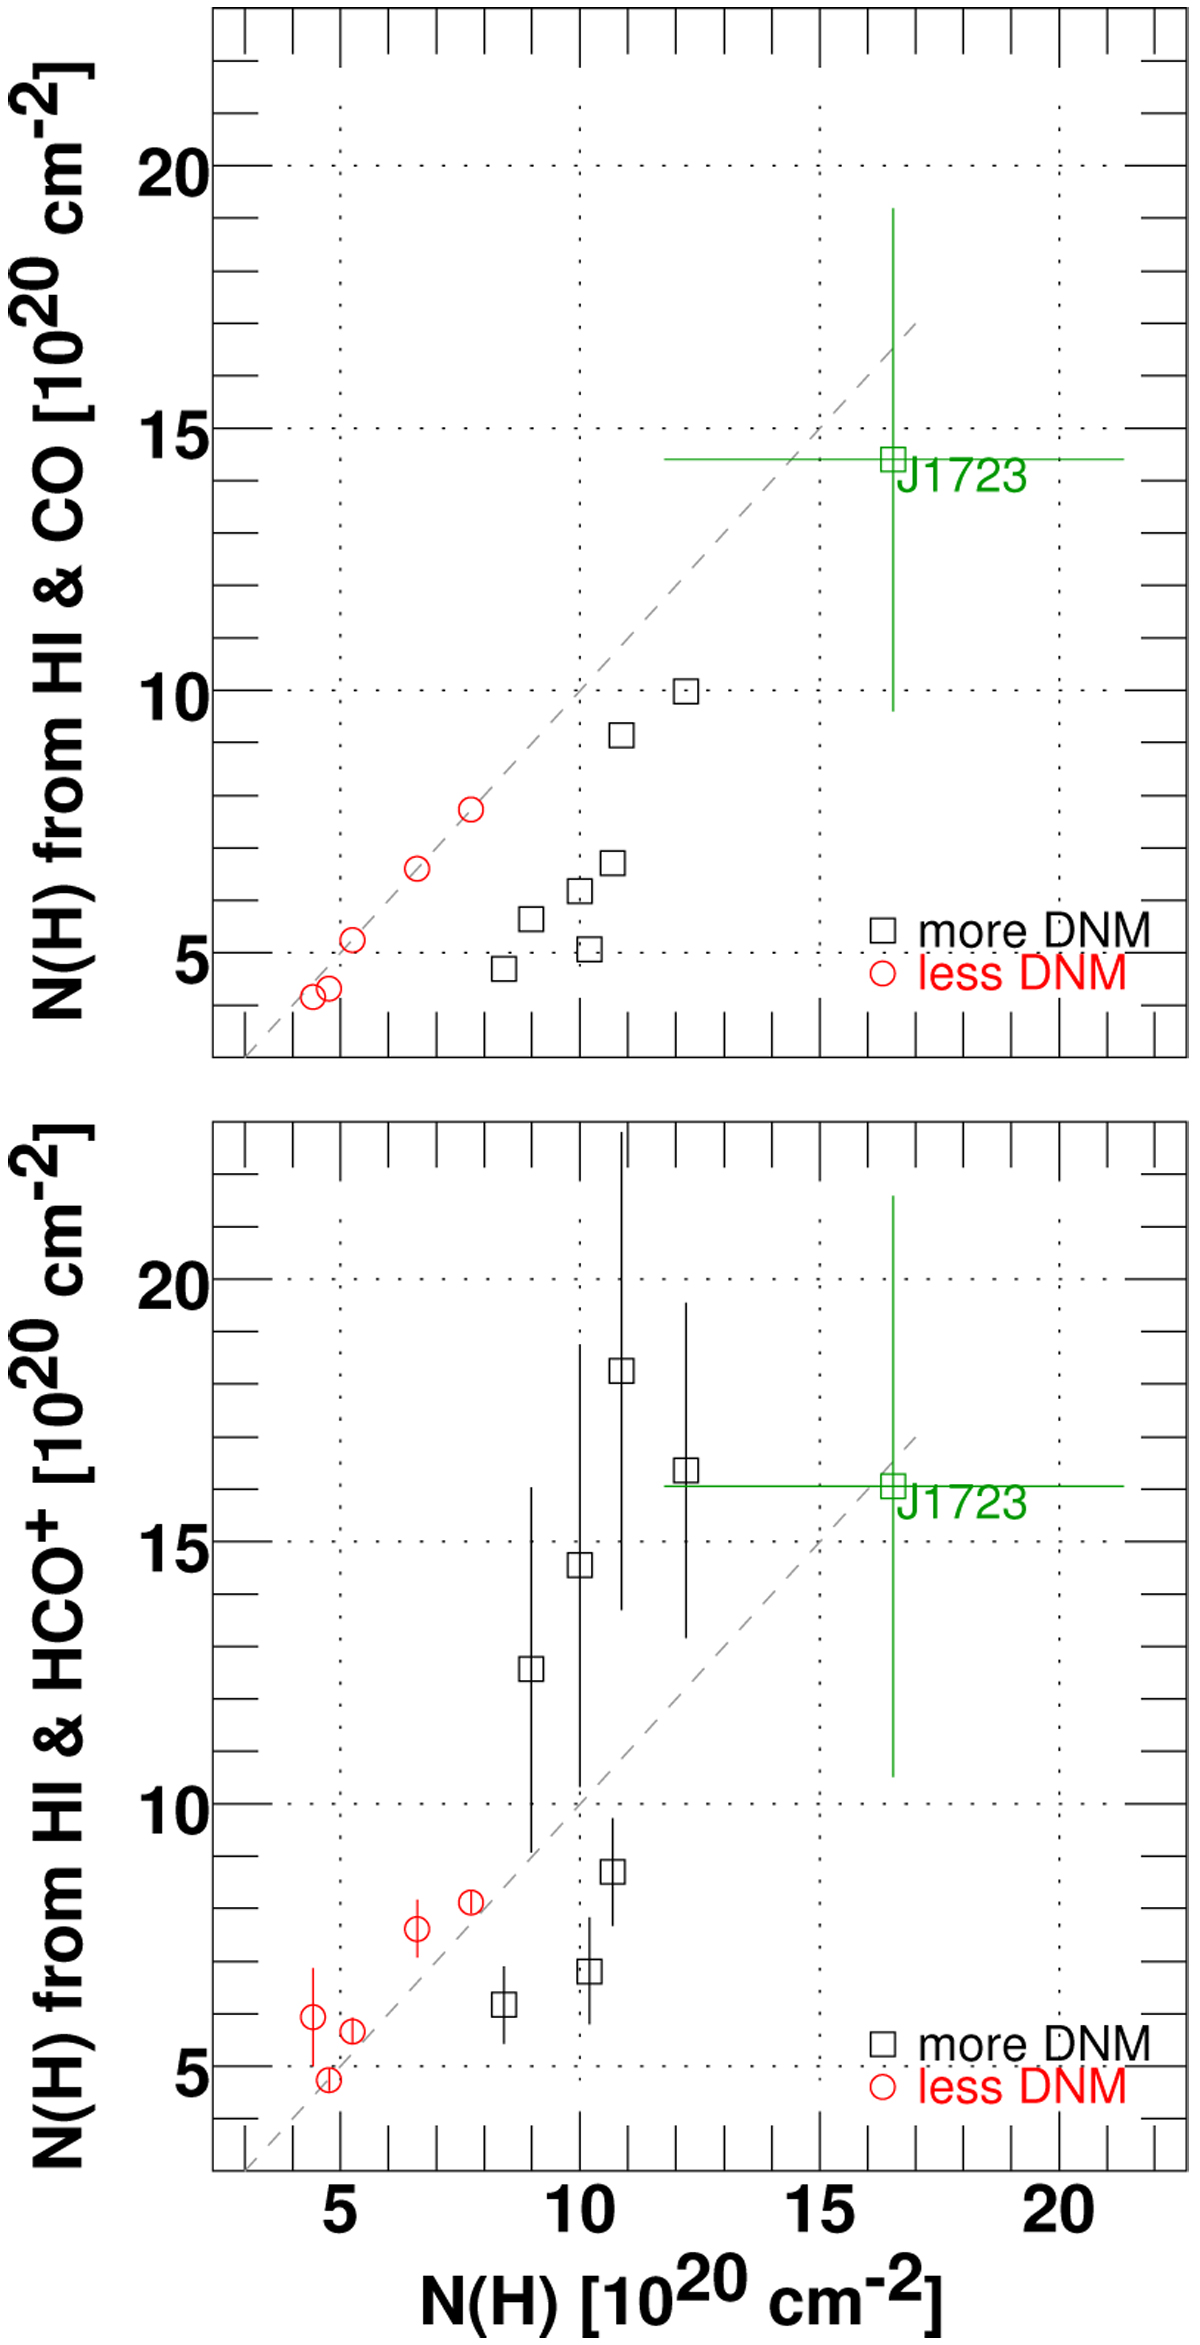
Comparison of total column density of H-nuclei N(H) derived from the DNM analysis and from observable column densities. The quantity plotted along the horizontal axis, N(H) = N(H I)|cham + N(DNM) + 2WCO ![]() , is thequantity fitted in the global DNM analysis and is the same in both panels. The vertical axis in each panel is the inferred total hydrogen column density N(H) = N(H I)|cham + 2N(H2) but calculated differently: at top, with N(H2) = WCO
, is thequantity fitted in the global DNM analysis and is the same in both panels. The vertical axis in each panel is the inferred total hydrogen column density N(H) = N(H I)|cham + 2N(H2) but calculated differently: at top, with N(H2) = WCO ![]() , and at bottom with N(H2) = N(HCO+)∕3 × 10⁻⁹. The error bars assume ± 50% errors in WCO and N(HCO+)/N(H2).
, and at bottom with N(H2) = N(HCO+)∕3 × 10⁻⁹. The error bars assume ± 50% errors in WCO and N(HCO+)/N(H2).
Current usage metrics show cumulative count of Article Views (full-text article views including HTML views, PDF and ePub downloads, according to the available data) and Abstracts Views on Vision4Press platform.
Data correspond to usage on the plateform after 2015. The current usage metrics is available 48-96 hours after online publication and is updated daily on week days.
Initial download of the metrics may take a while.