Fig. 5
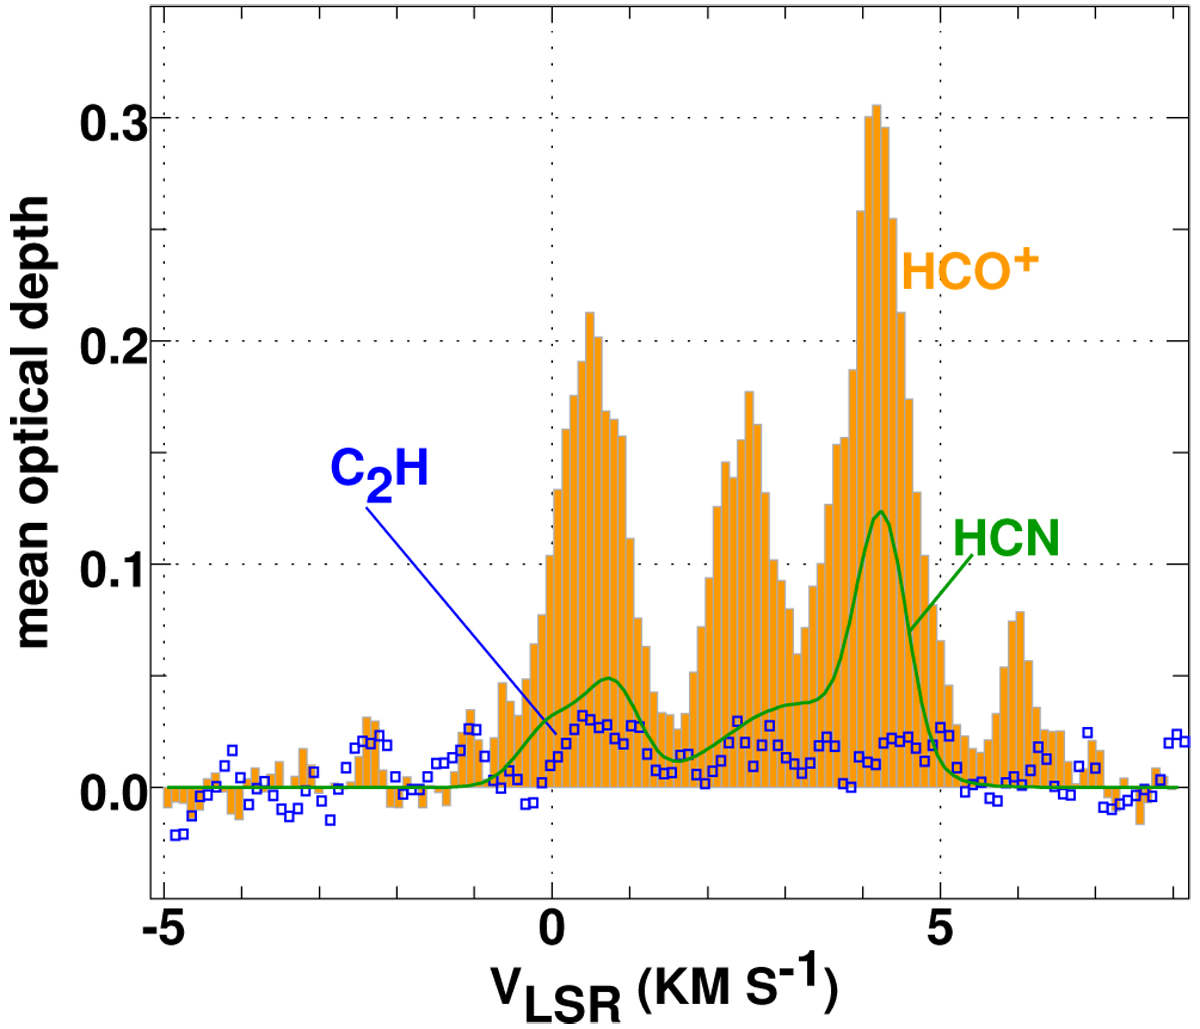
Mean optical depth profiles for strongly polar molecules for the eight sources with N(DNM) ≳ 2 × 1020 cm−2. The HCN profile in green shows the kinematic structure that would be convolved with the HCN hyperfine splitting toreproduce the observations assuming that the hyperfine components appear in the LTE ratio 5:3:1. C2H is shown in blue.
Current usage metrics show cumulative count of Article Views (full-text article views including HTML views, PDF and ePub downloads, according to the available data) and Abstracts Views on Vision4Press platform.
Data correspond to usage on the plateform after 2015. The current usage metrics is available 48-96 hours after online publication and is updated daily on week days.
Initial download of the metrics may take a while.