Free Access
Fig. 4
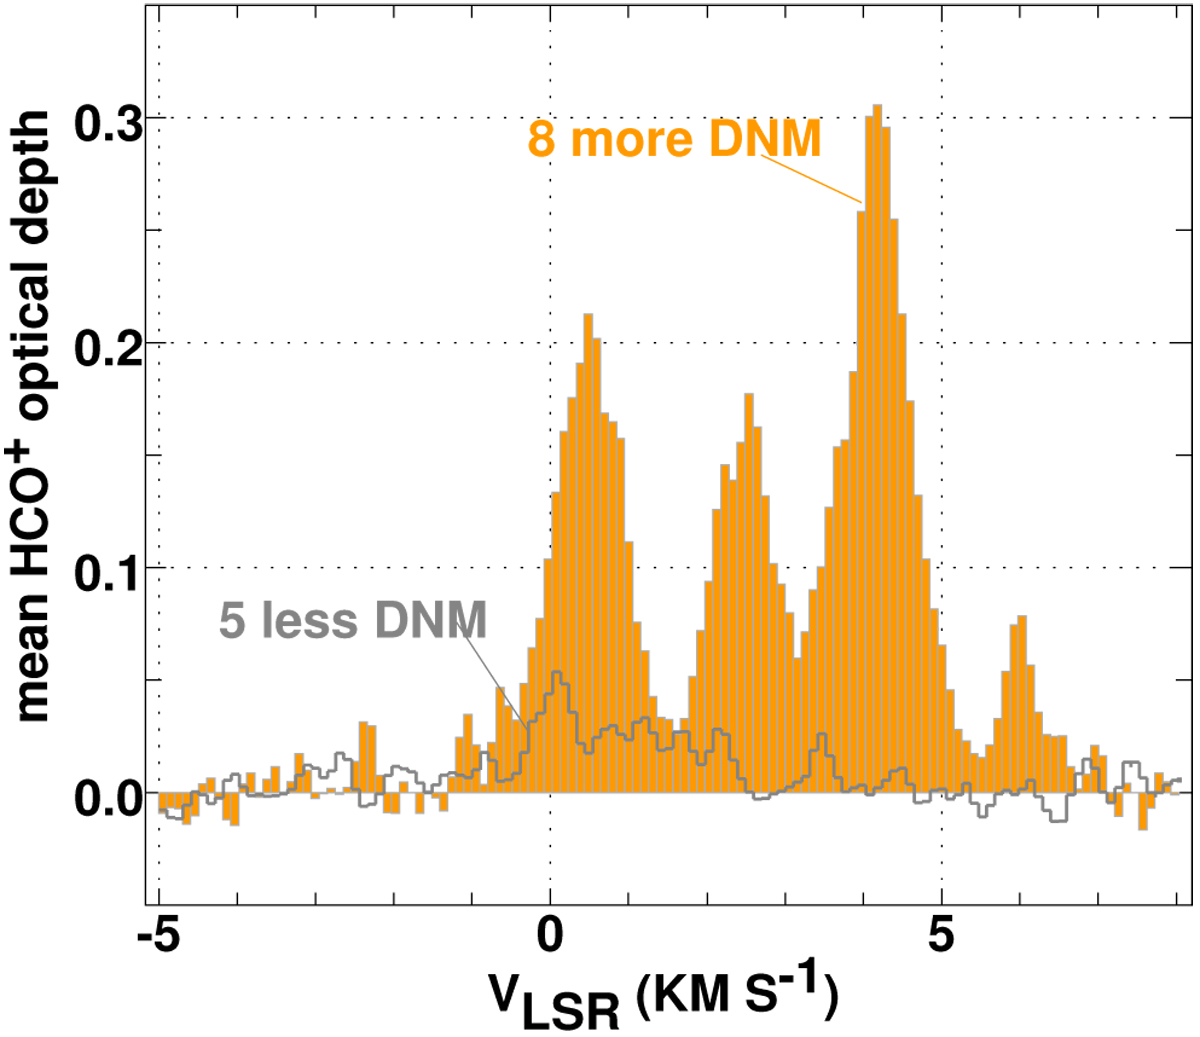
Kinematics of the molecular gas traced by HCO+, separated byN(DNM). Shown separately are the average HCO+ optical depths of the five sources with weak NDNM (dark gray histogram) and the eight sources with stronger N(DNM) (orange bars).
Current usage metrics show cumulative count of Article Views (full-text article views including HTML views, PDF and ePub downloads, according to the available data) and Abstracts Views on Vision4Press platform.
Data correspond to usage on the plateform after 2015. The current usage metrics is available 48-96 hours after online publication and is updated daily on week days.
Initial download of the metrics may take a while.