Fig. 3
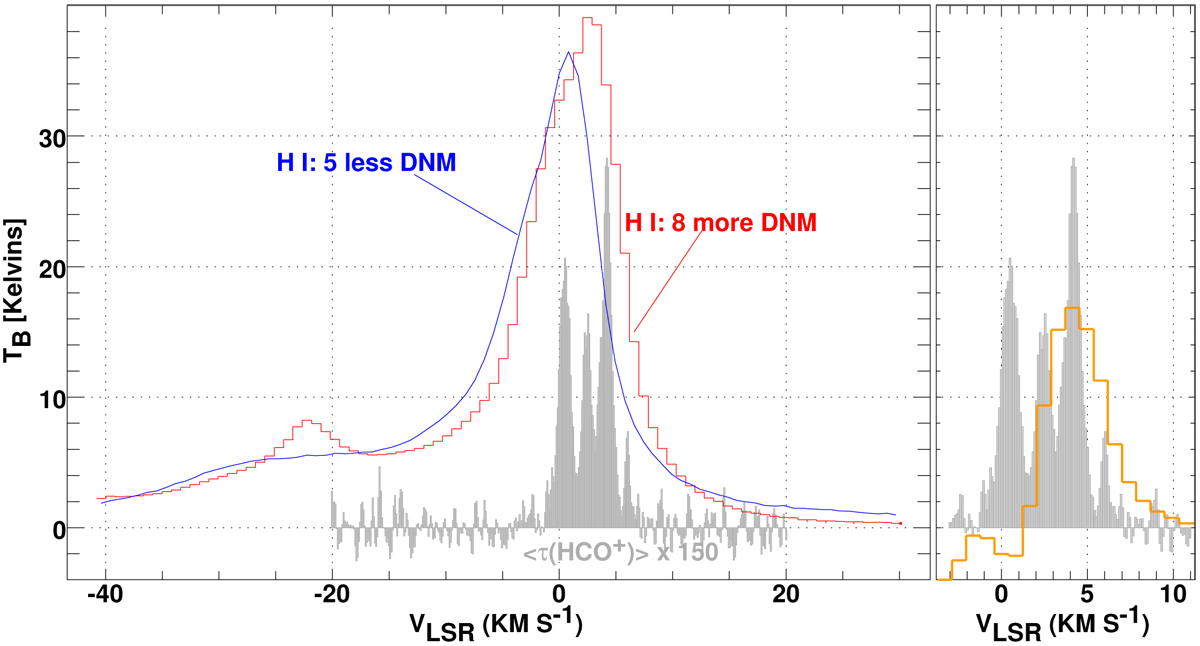
Kinematics of the H I, separated by N(DNM). Left panel: shown separately are the mean H I profiles for the two groups of sources according to their N(DNM): H I emission in the group having more DNM is plotted as a red histogram and emission in the other group is shown as a blue line. Also shown is the mean HCO+ optical depth profile for all sources scaled upward by a factor 150. Right panel: as in left panel but the H I profile plotted in orange is the difference of the H I profiles shown in left panel. The greatest difference between the H I profiles coincides with the peak of the HCO+ optical depth.
Current usage metrics show cumulative count of Article Views (full-text article views including HTML views, PDF and ePub downloads, according to the available data) and Abstracts Views on Vision4Press platform.
Data correspond to usage on the plateform after 2015. The current usage metrics is available 48-96 hours after online publication and is updated daily on week days.
Initial download of the metrics may take a while.