Fig. 1
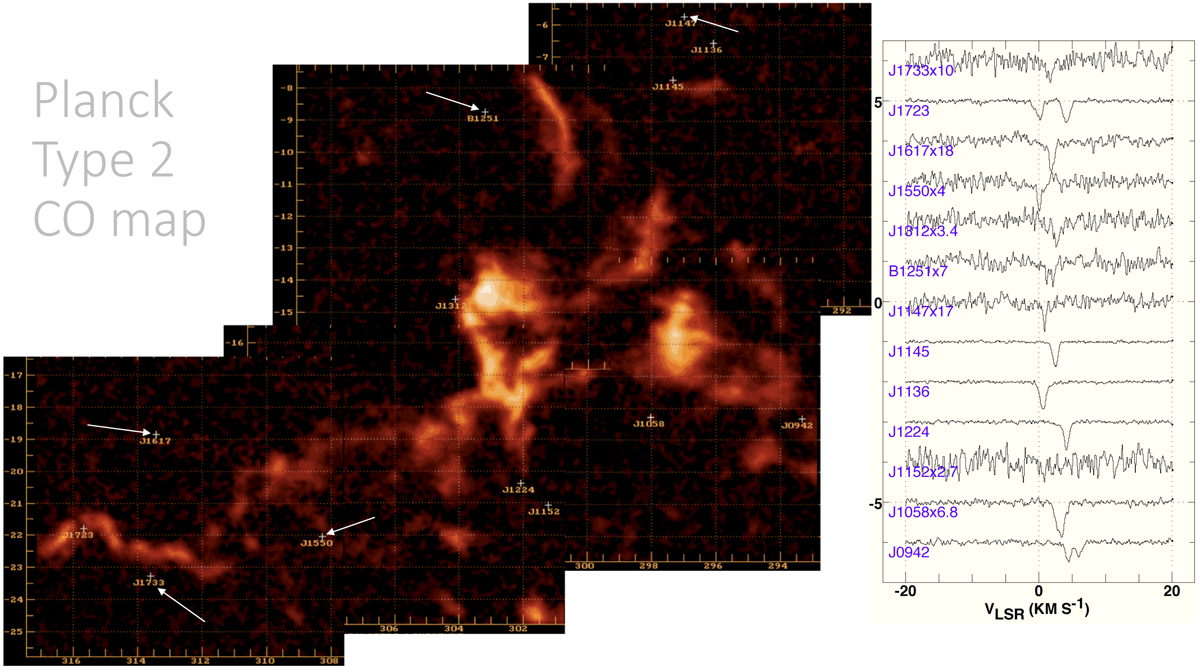
Left panel: the positions of the background sources observed here are projected against a mosaic of cutouts of Planck Type 2 integrated CO emission: the color scale runs from 0 to 23 K-km s−1. The five sources comprising the group with small N(DNM) are noted with arrows. Right panel: the HCO+ absorption profiles in all directions, shifted vertically and scaled up in some cases.
Current usage metrics show cumulative count of Article Views (full-text article views including HTML views, PDF and ePub downloads, according to the available data) and Abstracts Views on Vision4Press platform.
Data correspond to usage on the plateform after 2015. The current usage metrics is available 48-96 hours after online publication and is updated daily on week days.
Initial download of the metrics may take a while.