Fig. 1
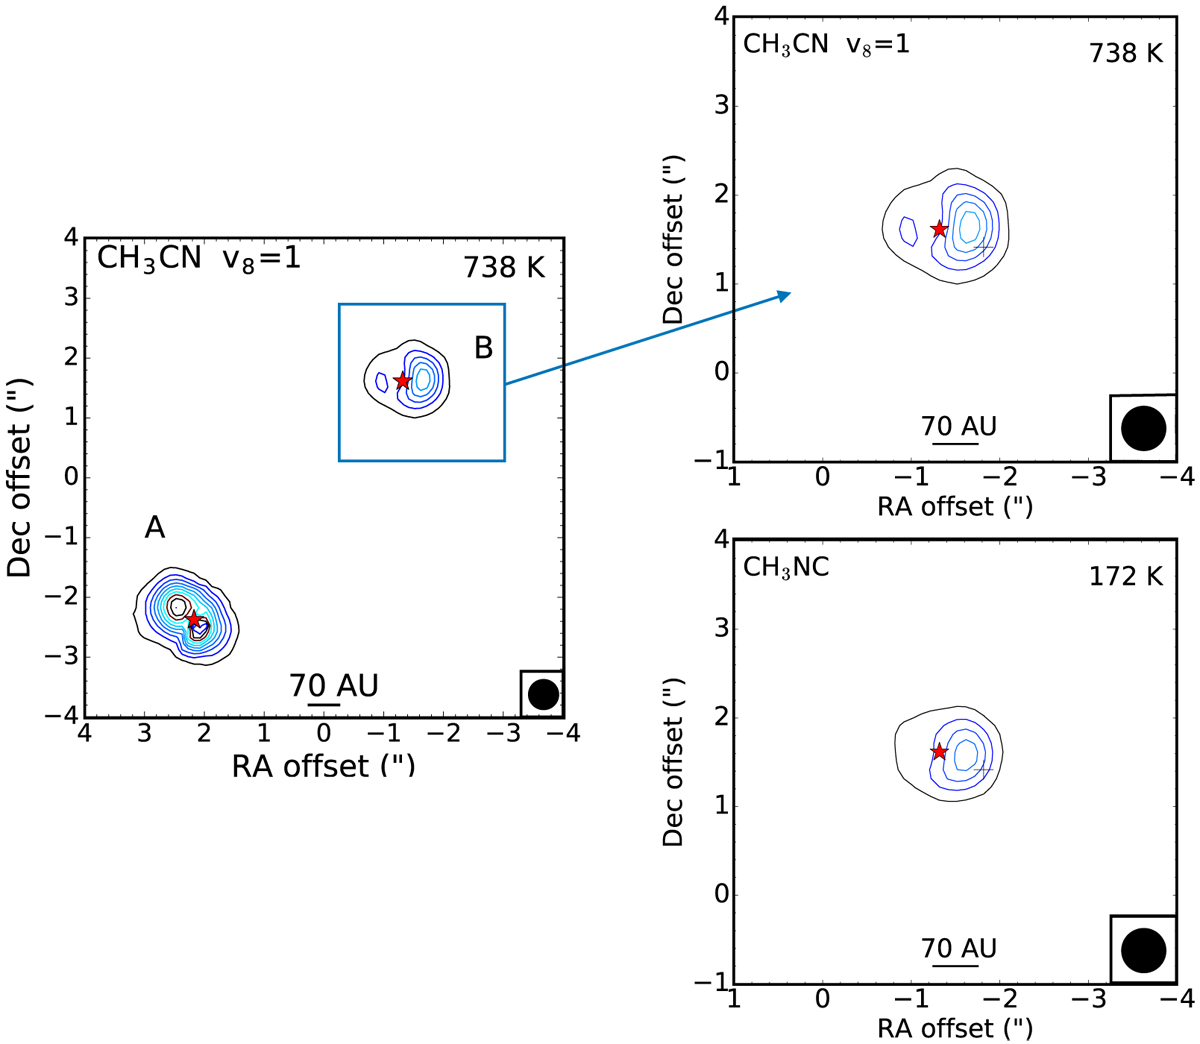
Left panel: velocity-corrected integrated emission (VINE) map of the 18±4 − 17∓4 v8 = 1 I = +1 transitions (332.029 GHz) of methyl cyanide, which are unresolved. Right panel: zoom in of the methyl cyanide emission towards IRAS 16293B and integrated emission map of the 181 – 171 v = 0 line (361.786GHz) of methyl isocyanide. For IRAS 16293B, six channels (1.2 km s−1) centred on the VLSR are integrated over. For IRAS 16293A, 16 channels (3.2 km s−1) centred on the Vpeak of each pixel are integrated over. The axes show the position offset from the phase centre of the observations. Contour levels start at 30 mJy km s−1 and increase in steps of 50 mJy km s−1. The red star marks the peak continuum position in each source and the black cross marks the offset position where the spectra analysed in this work are extracted from. The RA and Dec offsets are relative to the phase centre of the observations.
Current usage metrics show cumulative count of Article Views (full-text article views including HTML views, PDF and ePub downloads, according to the available data) and Abstracts Views on Vision4Press platform.
Data correspond to usage on the plateform after 2015. The current usage metrics is available 48-96 hours after online publication and is updated daily on week days.
Initial download of the metrics may take a while.