Fig. 9.
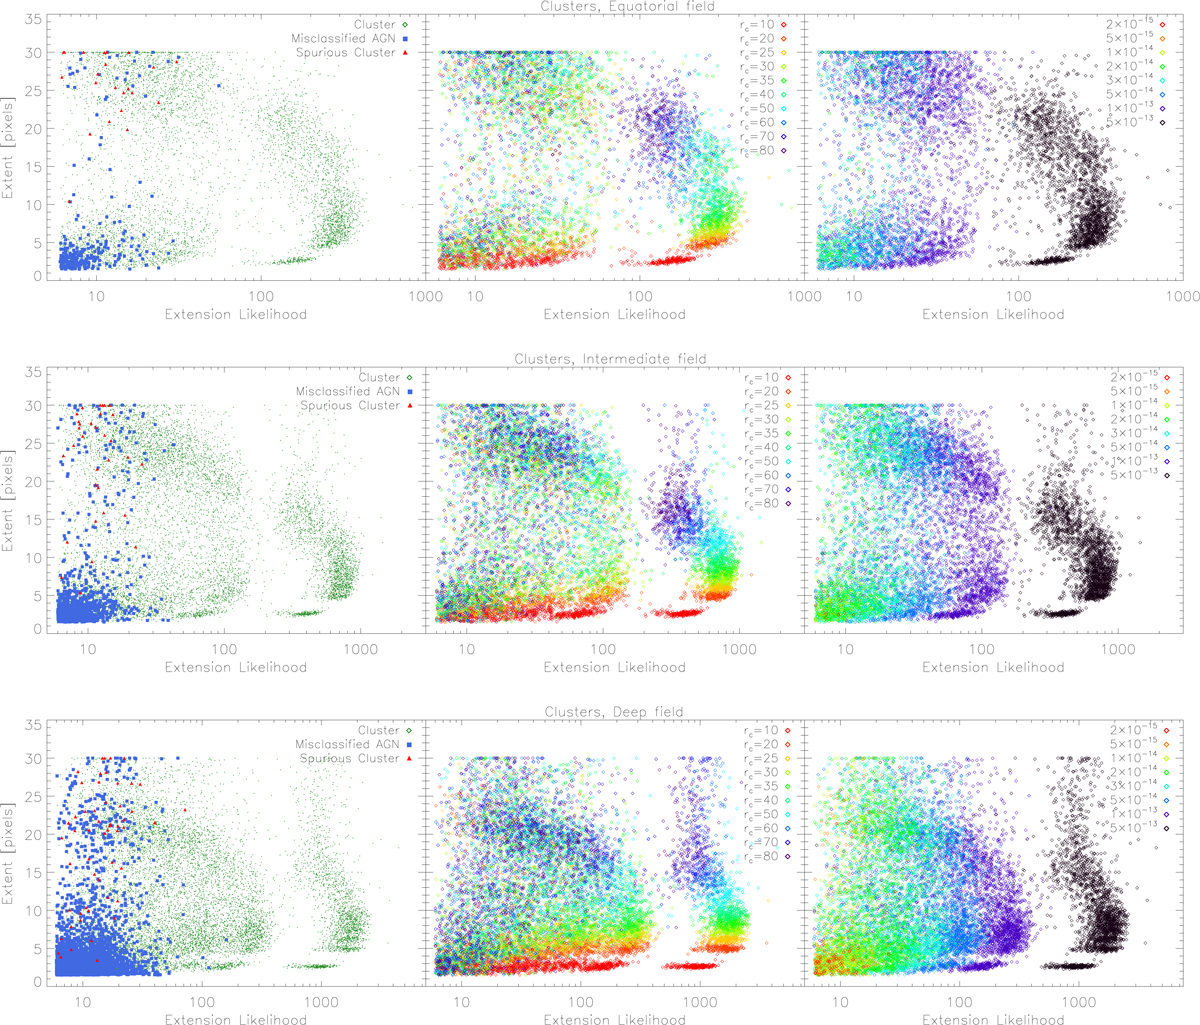
Final selection criteria for extended sources, from the preliminary version of the eSASS pipeline, with optimal (low-contamination) parameters. The extent–extension log-likelihood plane is shown for the three simulated sky fields: equatorial (top), intermediate (middle), and (deep) (bottom). Left panels: simulated (and detected) clusters are displayed as green dots, spurious extended detections as red triangles, and AGNs classified as extended sources in blue squares. Middle panels: only input detected galaxy clusters are displayed (green diamonds in the left panels). The distinct colours show the different simulated core radii (in arcsec). Right panels: only input detected galaxy clusters are displayed. The different colours show the distinct simulated input fluxes (in units of erg s−1 cm−2).
Current usage metrics show cumulative count of Article Views (full-text article views including HTML views, PDF and ePub downloads, according to the available data) and Abstracts Views on Vision4Press platform.
Data correspond to usage on the plateform after 2015. The current usage metrics is available 48-96 hours after online publication and is updated daily on week days.
Initial download of the metrics may take a while.