Fig. 8.
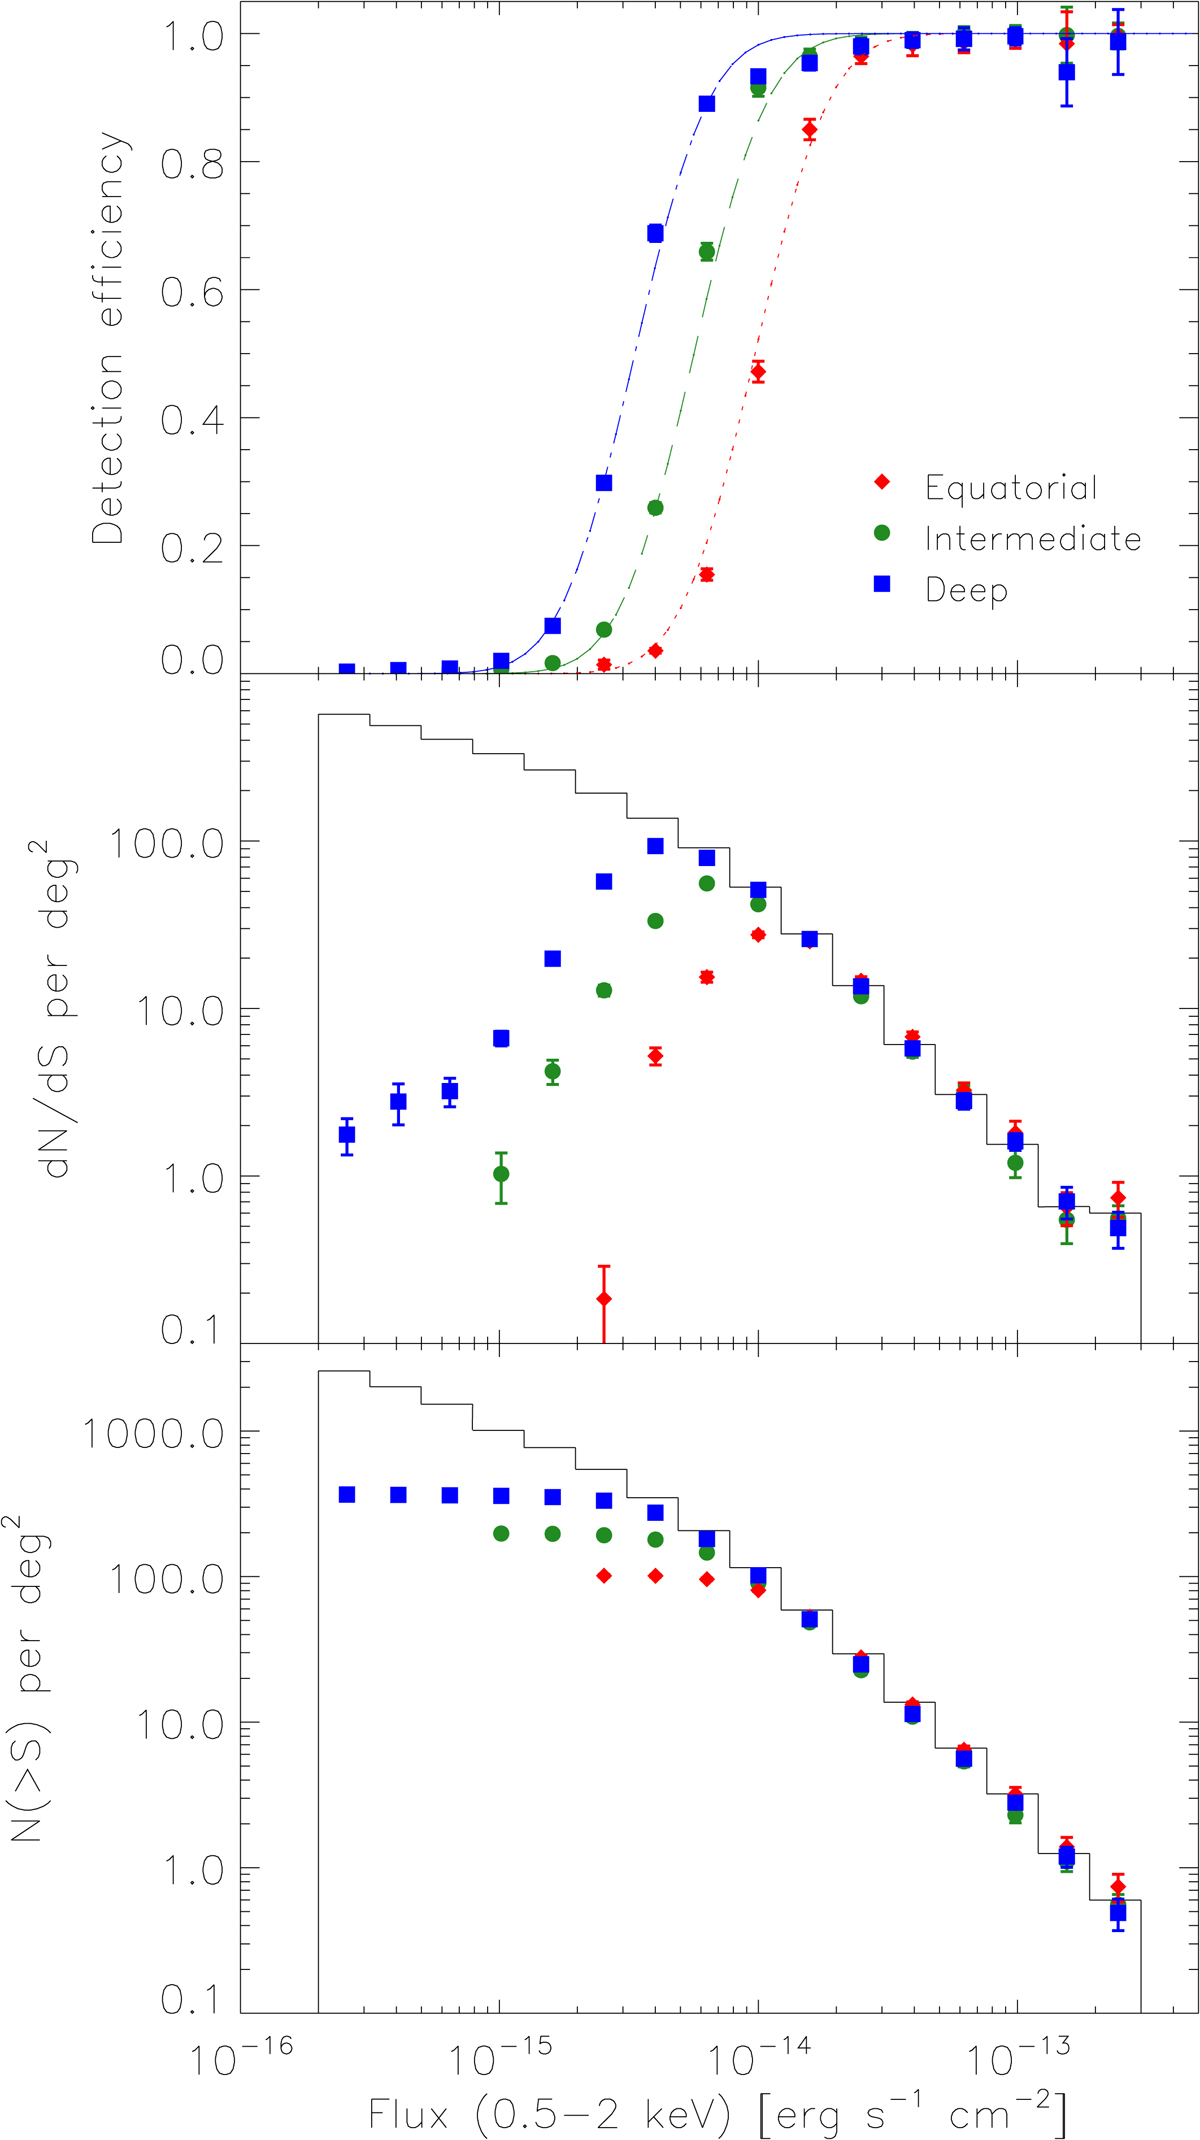
Point-like source completeness analysis for all three simulated sky regions: Equatorial (red diamonds), Intermediate (green circles) and Deep (blue squares). The abscissa is the input source flux. Top panel: point-like detection efficiency. Discontinuous lines represent the parametrized models described in Appendix A. Middle panel: differential number counts. Bottom panel: integral number of point-like sources. In the middle and bottom panels, the solid line shows the input distribution. The error is given by the standard deviation over the simulations.
Current usage metrics show cumulative count of Article Views (full-text article views including HTML views, PDF and ePub downloads, according to the available data) and Abstracts Views on Vision4Press platform.
Data correspond to usage on the plateform after 2015. The current usage metrics is available 48-96 hours after online publication and is updated daily on week days.
Initial download of the metrics may take a while.