Fig. 6.
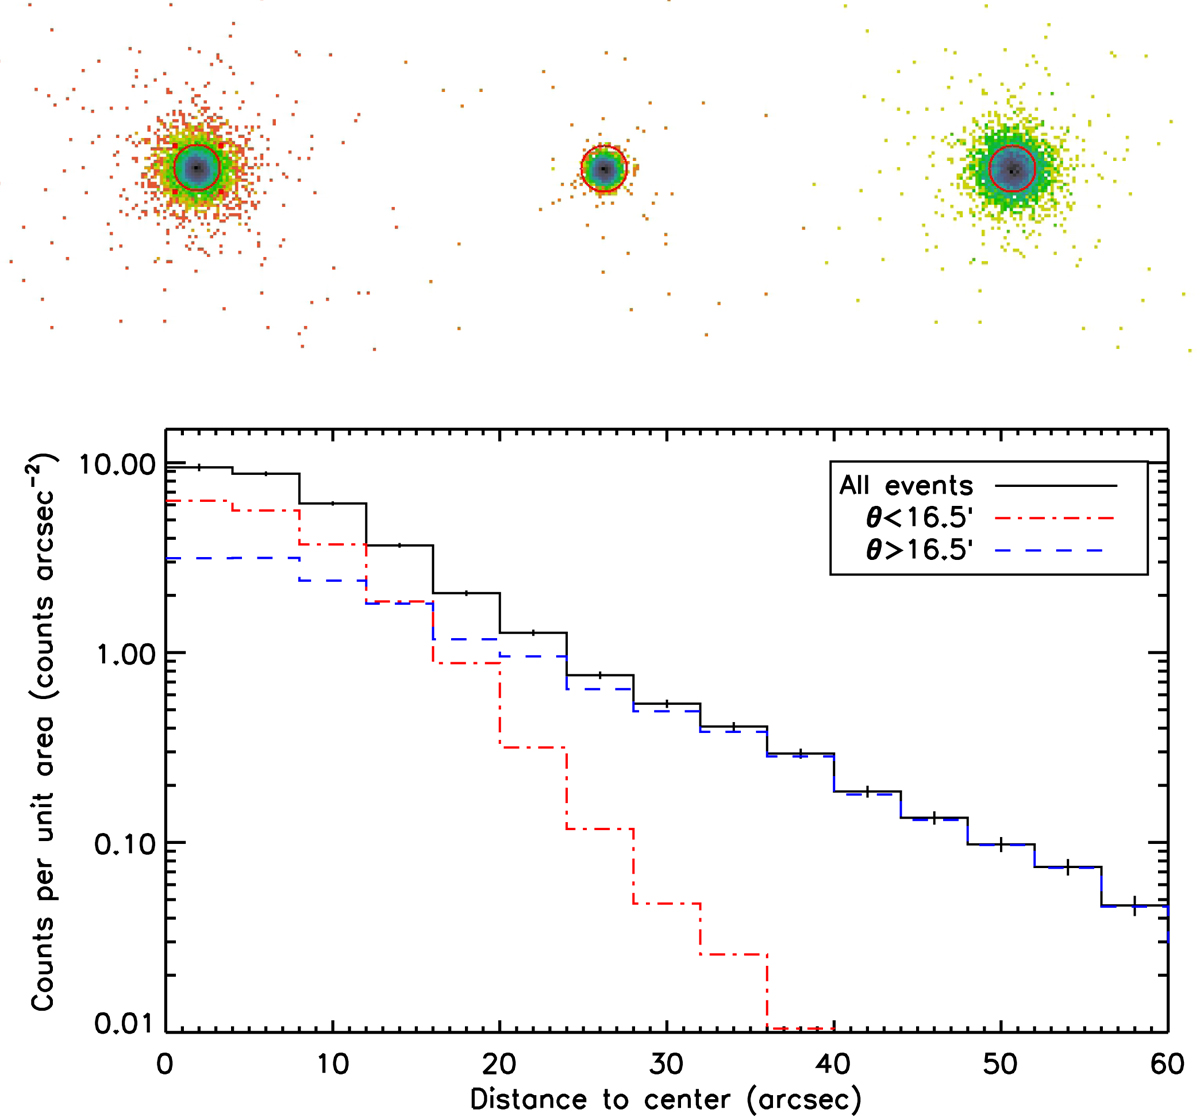
Top panel: simulation of a bright point-source with flux 10−11 erg s−1 cm−2 in a four-year eROSITA equatorial region (∼2 ks exposure time). The image shows the sky projection of the 0.5–2 keV source events collected by the seven CCD, binned with 4″ pixels. Left: “Survey PSF”, including all events. Middle: selecting only low off-axis events (θ < 16.5′, 40% of the total number of events). Right: selecting only large off-axis events (θ > 16.5′, 60%). The circle has a radius of 30″, slightly larger than the half-energy width of the survey PSF. Bottom panel: corresponding radial profiles in 4″ bins (error bars are only shown for the top curve).
Current usage metrics show cumulative count of Article Views (full-text article views including HTML views, PDF and ePub downloads, according to the available data) and Abstracts Views on Vision4Press platform.
Data correspond to usage on the plateform after 2015. The current usage metrics is available 48-96 hours after online publication and is updated daily on week days.
Initial download of the metrics may take a while.