Fig. 5.
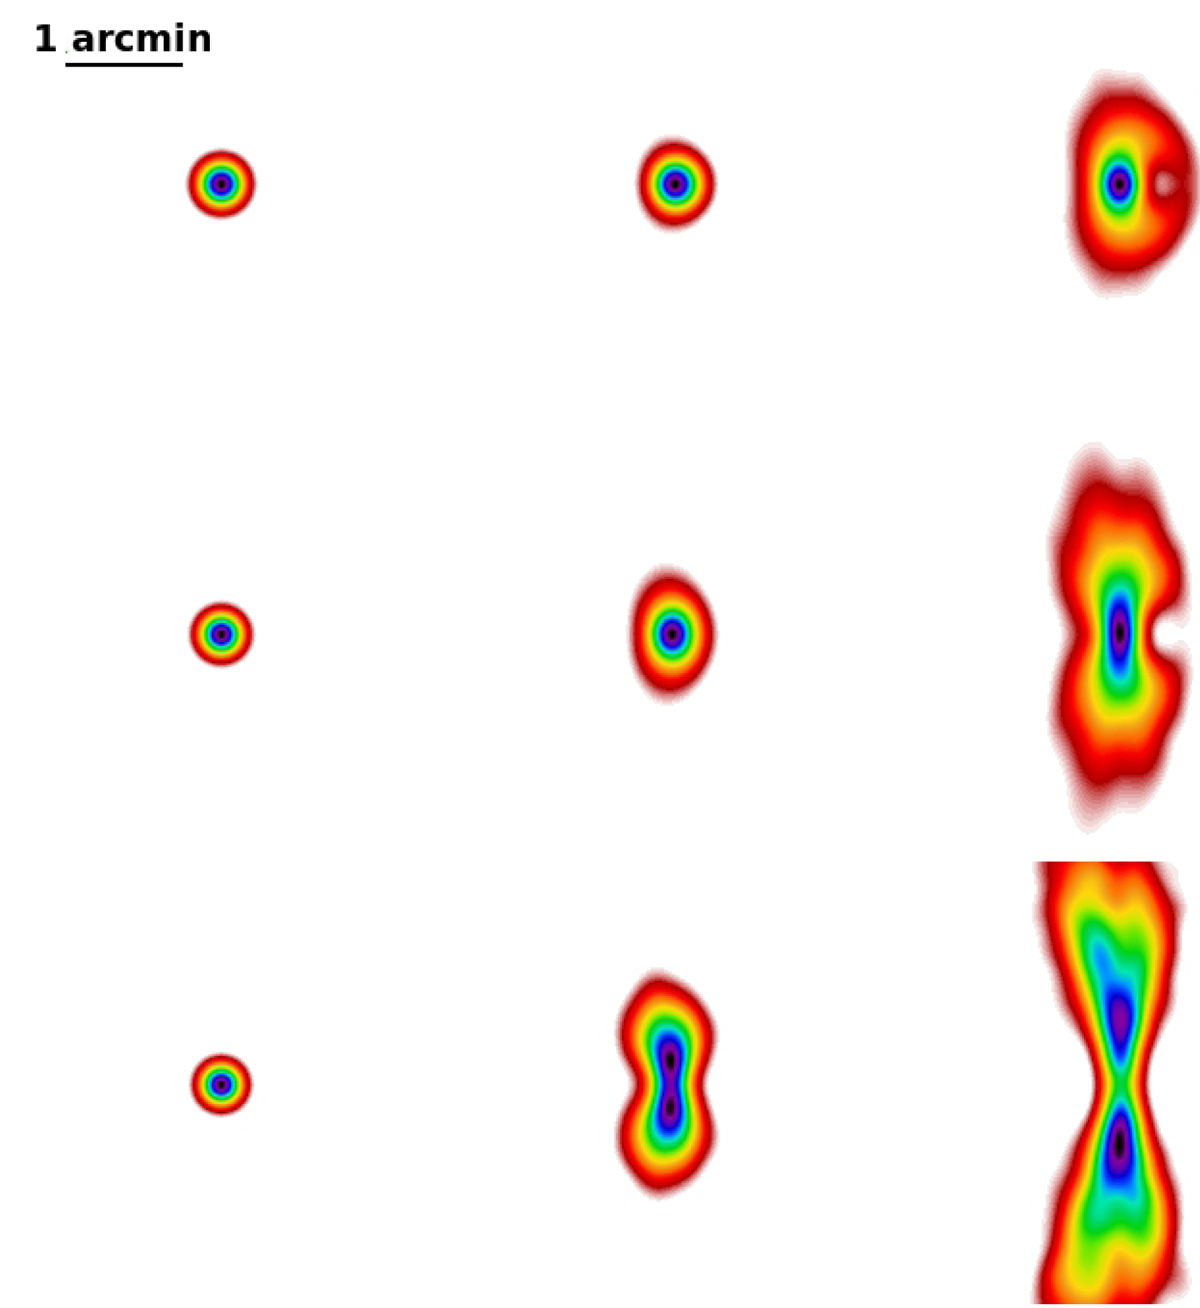
Ray-tracing simulated telescope point-spread function used in this paper. The images show the response of one eROSITA mirror module to a point-source at different incoming photon energies (from top to bottom: 1, 3 and 7 keV) and different angular distances from the optical axis (from left to right: on-axis, 15′, 25′). The colour scale in each panel is linear and encompasses the tenfold increase between the minimal (light red) and maximal (black) intensity, thereby emphasising the typical shape distortions due to Wolter optics.
Current usage metrics show cumulative count of Article Views (full-text article views including HTML views, PDF and ePub downloads, according to the available data) and Abstracts Views on Vision4Press platform.
Data correspond to usage on the plateform after 2015. The current usage metrics is available 48-96 hours after online publication and is updated daily on week days.
Initial download of the metrics may take a while.