Fig. 4.
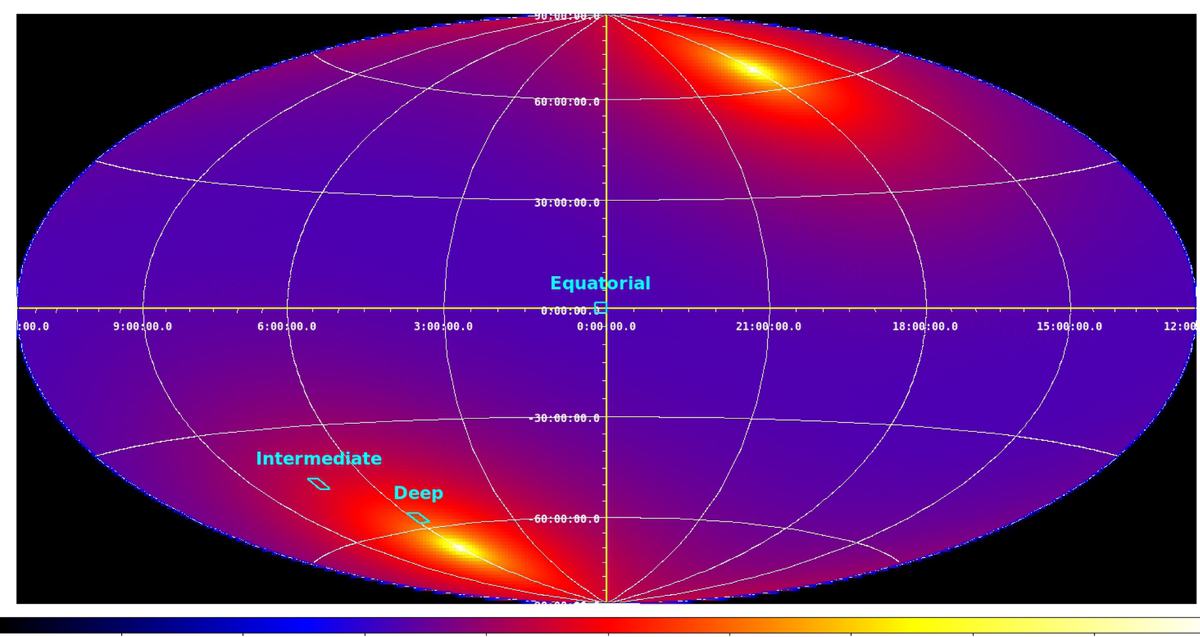
Simulated eROSITA all-sky four-year exposure map in equatorial coordinates used in this work, with the location of the three relevant simulated fields: equatorial (∼2 ks exposure time, uniform), intermediate (∼4 ks, slight gradient), and deep (∼10 ks, larger gradient). The colour bar (logarithmic scale) is in units of seconds.
Current usage metrics show cumulative count of Article Views (full-text article views including HTML views, PDF and ePub downloads, according to the available data) and Abstracts Views on Vision4Press platform.
Data correspond to usage on the plateform after 2015. The current usage metrics is available 48-96 hours after online publication and is updated daily on week days.
Initial download of the metrics may take a while.