Fig. 3.
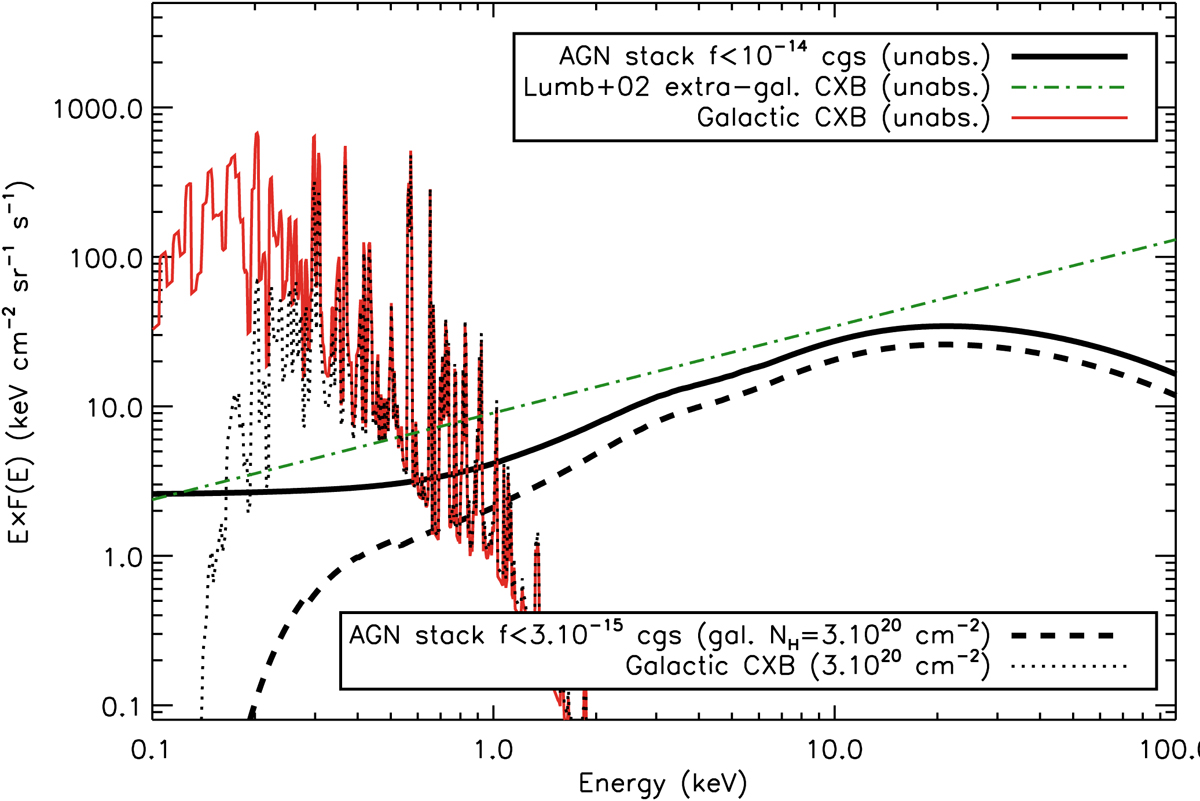
Energy spectrum of the simulated cosmic X-ray background components. The thick black dashed and plain lines are obtained with our model for AGN sources by stacking individual spectra of faint sources below flim = 10−14 (plain) or 3 × 10⁻¹⁵ (dashed erg s−1 cm−2. For comparison, the dot-dashed green line shows the model of Lumb et al. (2002) derived from XMM-Newton observations. Our emission model for the Galaxy (red and dotted lines) is described in the text.
Current usage metrics show cumulative count of Article Views (full-text article views including HTML views, PDF and ePub downloads, according to the available data) and Abstracts Views on Vision4Press platform.
Data correspond to usage on the plateform after 2015. The current usage metrics is available 48-96 hours after online publication and is updated daily on week days.
Initial download of the metrics may take a while.