Fig. 12.
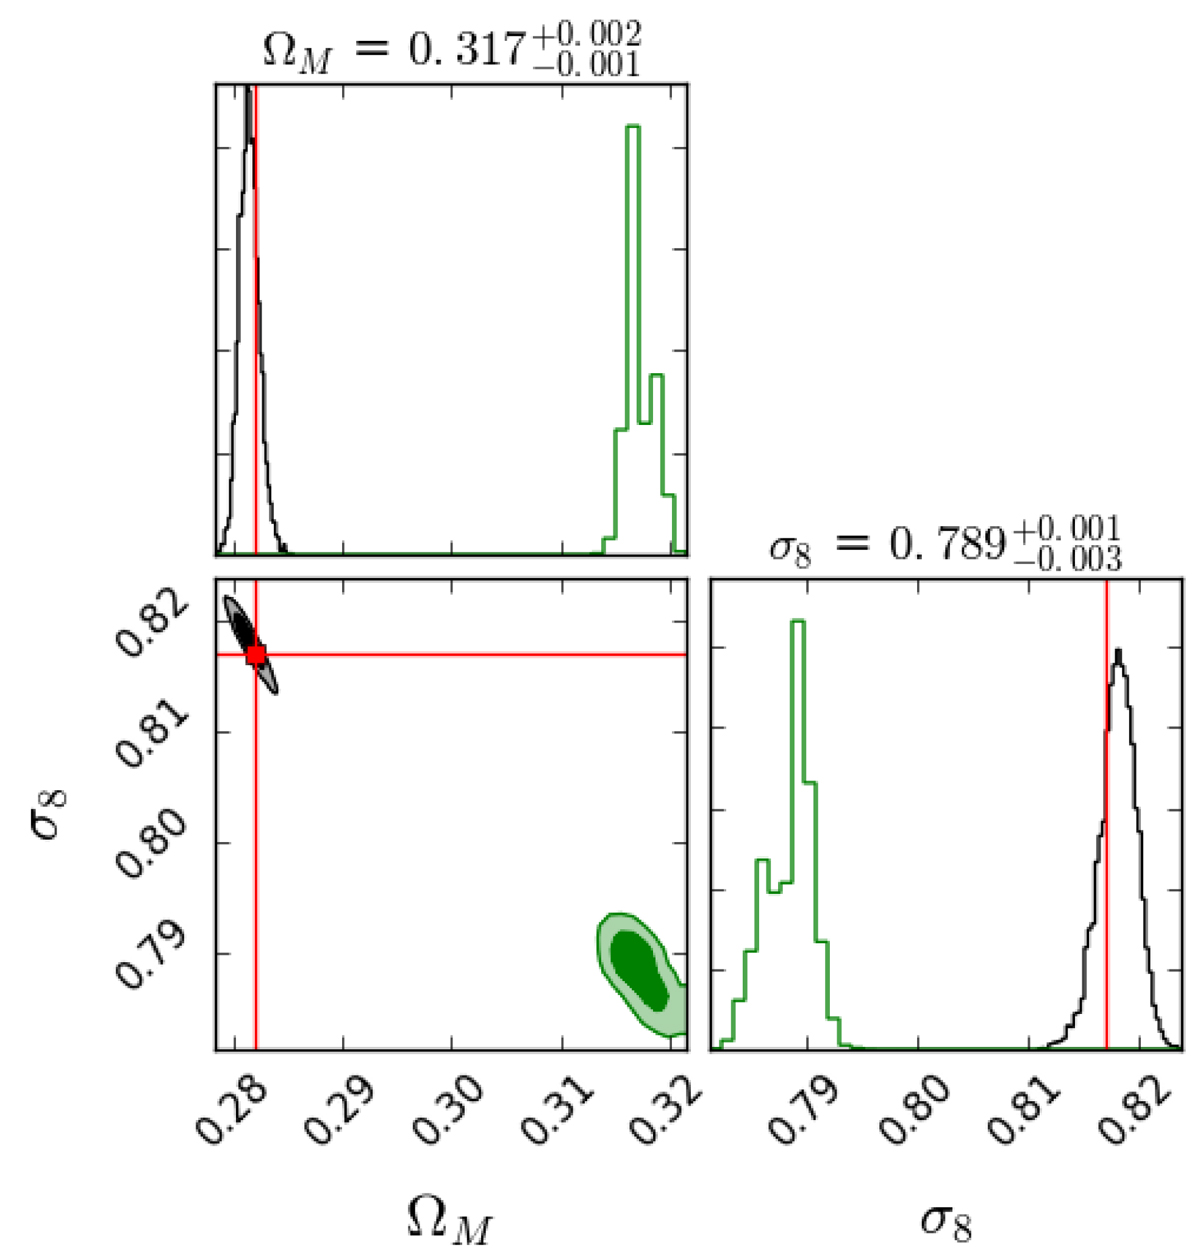
Bias introduced by the single core radius selection function. The black contours show the recovered constraints from the complete selection function while the green contours are the results obtained by fitting the cosmology assuming a single core radius in the selection function. The contours represent the 68% and 95% confidence intervals, respectively. The red lines indicate the position of the fiducial input values used in the creation of the mock catalogue and the values quoted above the plots indicate the median value recovered when using the incorrect selection function.
Current usage metrics show cumulative count of Article Views (full-text article views including HTML views, PDF and ePub downloads, according to the available data) and Abstracts Views on Vision4Press platform.
Data correspond to usage on the plateform after 2015. The current usage metrics is available 48-96 hours after online publication and is updated daily on week days.
Initial download of the metrics may take a while.