Fig. 1.
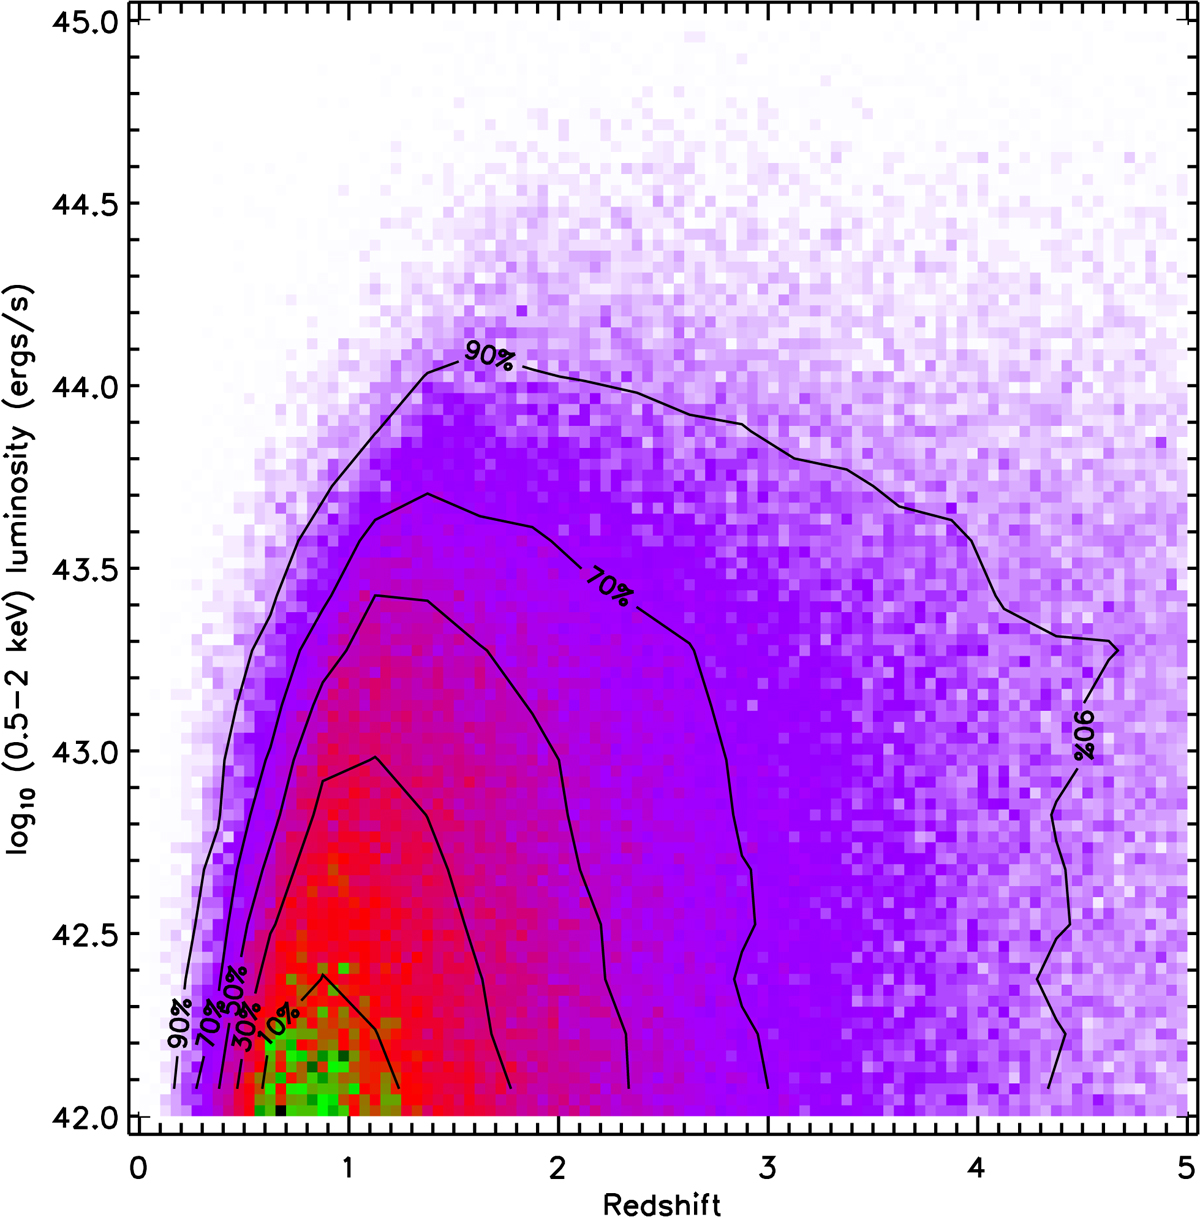
Two-dimensional histogram distribution of simulated sources in one realisation of our X-ray AGN luminosity function sampling for a 22.7 deg2 area on the sky (253, 297 sources in total). Each black contour encloses the fraction of sources indicated as a label. To each source belongs one X-ray spectral model uniquely defined by the source luminosity, redshift, power-law index Γ and absorbing column density NH (Sect. 2.1).
Current usage metrics show cumulative count of Article Views (full-text article views including HTML views, PDF and ePub downloads, according to the available data) and Abstracts Views on Vision4Press platform.
Data correspond to usage on the plateform after 2015. The current usage metrics is available 48-96 hours after online publication and is updated daily on week days.
Initial download of the metrics may take a while.