Fig. 1
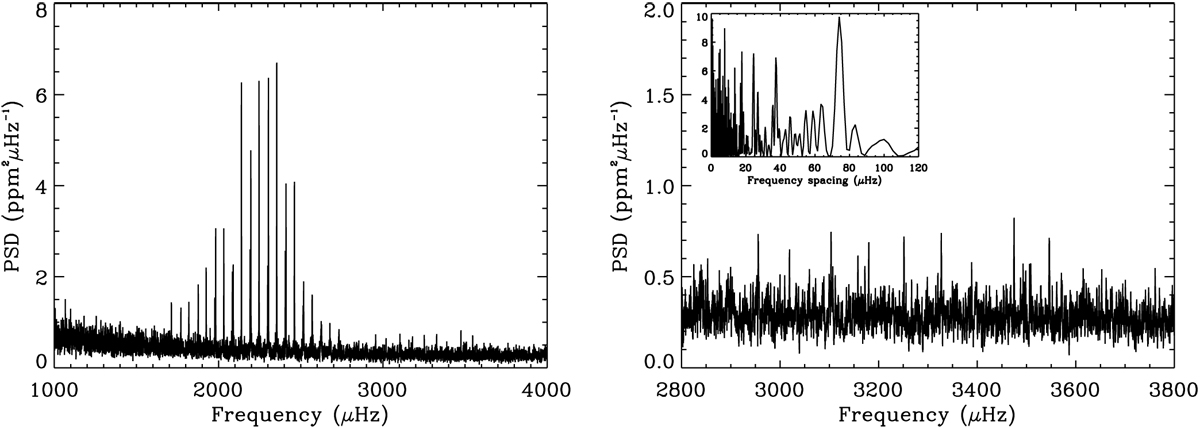
Power spectrum of HD 188753. Left panel: power spectrum smoothed with a 1 μHz boxcar filter showing the oscillation modes of the two seismic components around 2200 and 3300 μHz, respectively. Right panel: zoom-in on the mode power peaks of the secondary component. The inset displays the power spectrum of the power spectrum (PSPS) computed over the frequency range of the oscillations around νmax = 3274 ± 67 μHz (see Table 1).
Current usage metrics show cumulative count of Article Views (full-text article views including HTML views, PDF and ePub downloads, according to the available data) and Abstracts Views on Vision4Press platform.
Data correspond to usage on the plateform after 2015. The current usage metrics is available 48-96 hours after online publication and is updated daily on week days.
Initial download of the metrics may take a while.