Fig. 9.
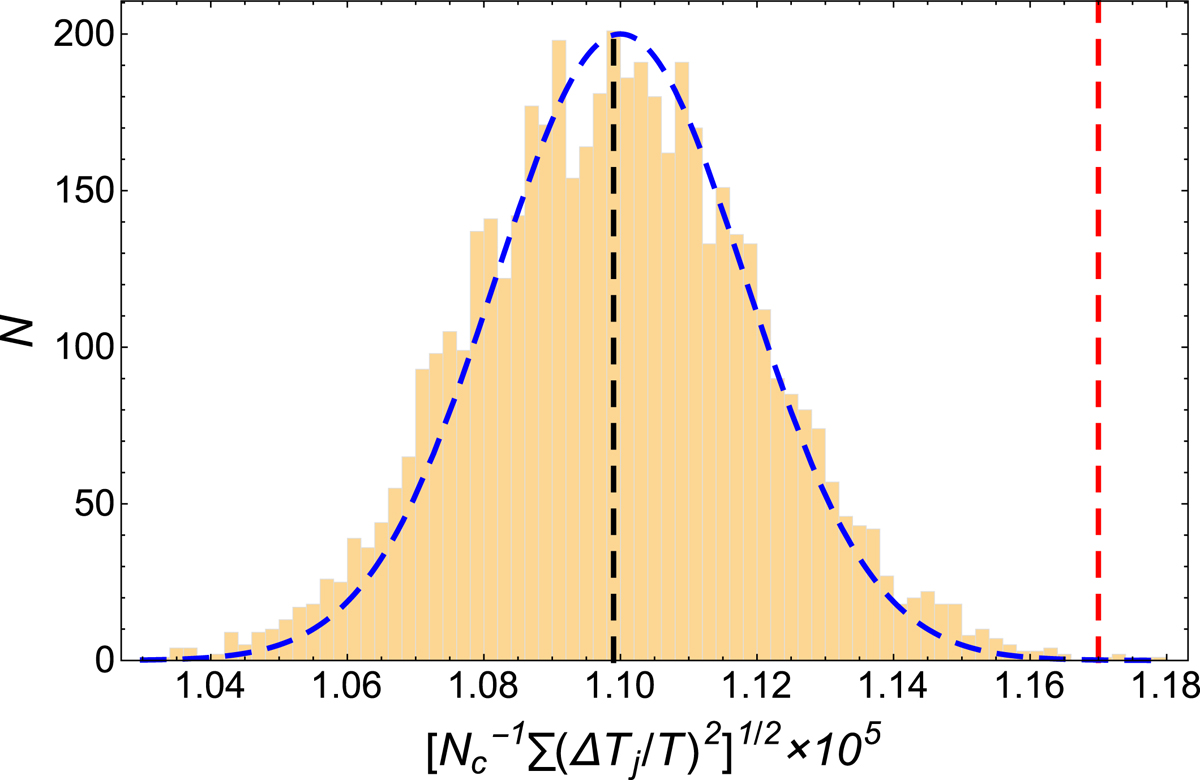
Distribution of the rms for 5000 mock catalogues (yellow histogram); here each catalogue consists of Nc randomly chosen positions on the filtered 2D-ILC map. The mean and rms of the 5000 random catalogues are 1.10 × 10⁻⁵ (shown as the black dashed vertical line) and 2.15 × 10⁻⁷, respectively. For the Nc true MCXC cluster positions, the rms is 1.17 × 10⁻⁵ (red vertical dashed line).
Current usage metrics show cumulative count of Article Views (full-text article views including HTML views, PDF and ePub downloads, according to the available data) and Abstracts Views on Vision4Press platform.
Data correspond to usage on the plateform after 2015. The current usage metrics is available 48-96 hours after online publication and is updated daily on week days.
Initial download of the metrics may take a while.