Fig. 8.
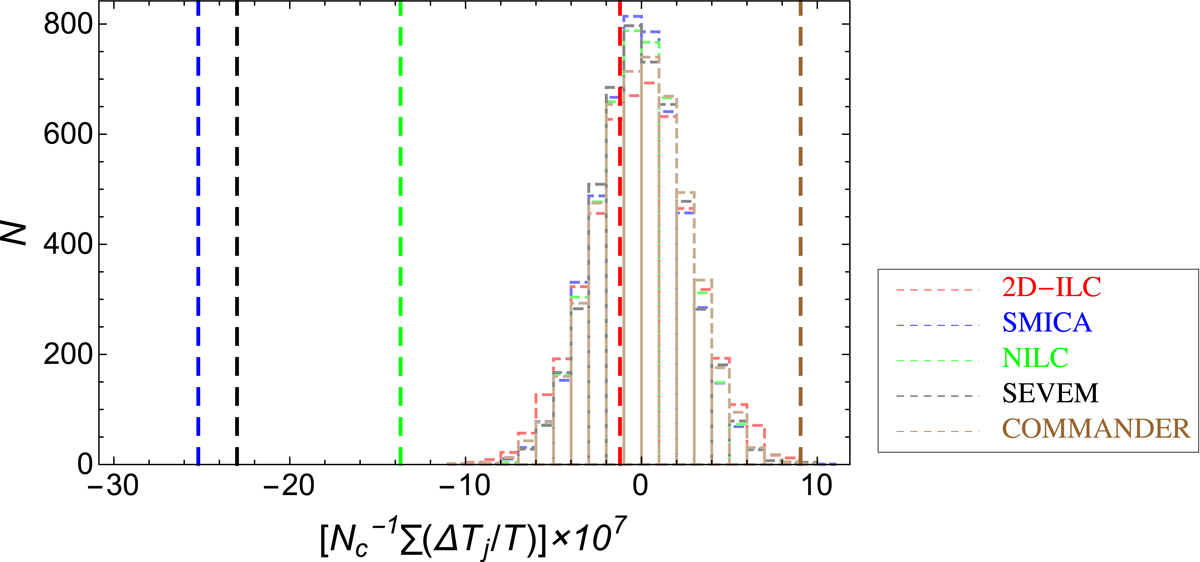
Histogram of the ![]() values of 5000 random catalogues on the sky (each having Nc = 1526), with different colours representing different Planck foreground-cleaned maps. The 68% width of the 2D-ILC, SMICA, NILC, SEVEM and Commander histograms are 2.86, 2.49, 2.48, 2.53, 2.62 (×10−7), respectively. The vertical lines represent the average ΔT/T values at true MCXC cluster positions for each map. One can see that only for the 2D-ILC map is this value within the 68% range of the random catalogue distribution, while others are quite far off. This indicates that, except for the 2D-ILC map, the public Planck maps have residual tSZ contamination at the cluster positions.
values of 5000 random catalogues on the sky (each having Nc = 1526), with different colours representing different Planck foreground-cleaned maps. The 68% width of the 2D-ILC, SMICA, NILC, SEVEM and Commander histograms are 2.86, 2.49, 2.48, 2.53, 2.62 (×10−7), respectively. The vertical lines represent the average ΔT/T values at true MCXC cluster positions for each map. One can see that only for the 2D-ILC map is this value within the 68% range of the random catalogue distribution, while others are quite far off. This indicates that, except for the 2D-ILC map, the public Planck maps have residual tSZ contamination at the cluster positions.
Current usage metrics show cumulative count of Article Views (full-text article views including HTML views, PDF and ePub downloads, according to the available data) and Abstracts Views on Vision4Press platform.
Data correspond to usage on the plateform after 2015. The current usage metrics is available 48-96 hours after online publication and is updated daily on week days.
Initial download of the metrics may take a while.