Free Access
Fig. 5.
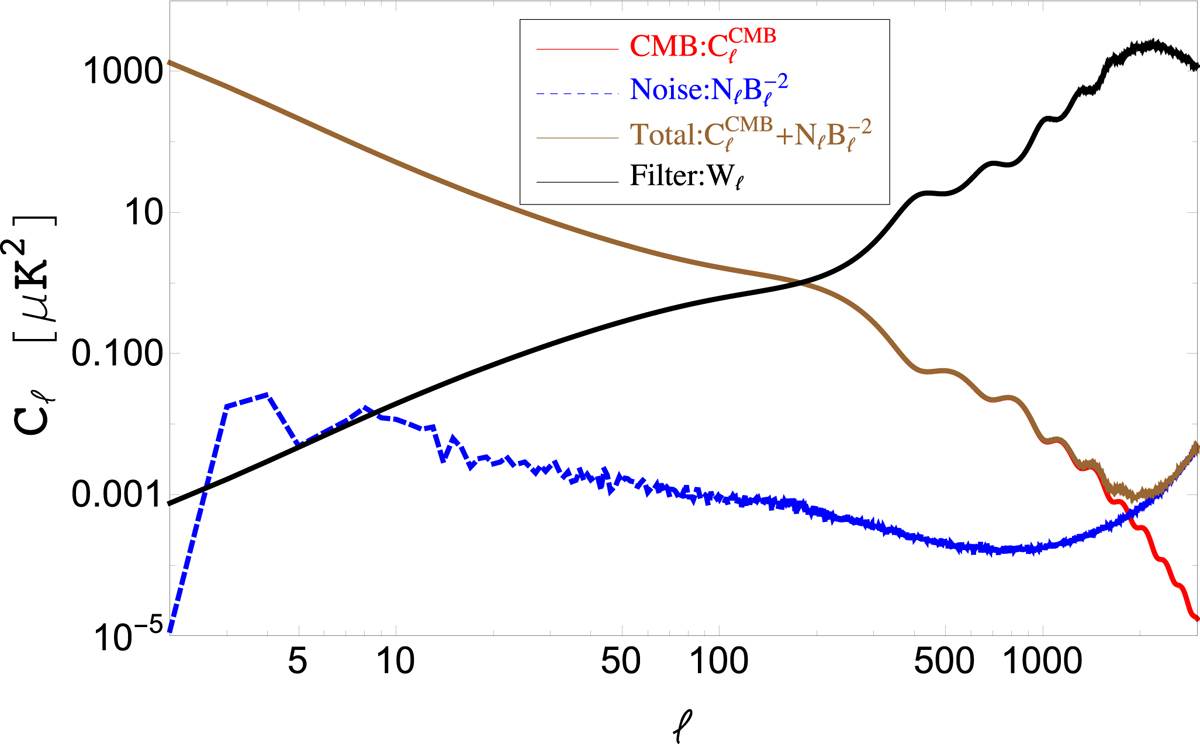
Optimal matched filter (black line) for point-source detection in the Planck2D-ILC map (Eq. (14)). For comparison, the power spectra of the CMB signal (red line) and noise map (blue dashed line) are shown, along with their sum (brown line).
Current usage metrics show cumulative count of Article Views (full-text article views including HTML views, PDF and ePub downloads, according to the available data) and Abstracts Views on Vision4Press platform.
Data correspond to usage on the plateform after 2015. The current usage metrics is available 48-96 hours after online publication and is updated daily on week days.
Initial download of the metrics may take a while.