Fig. 2.
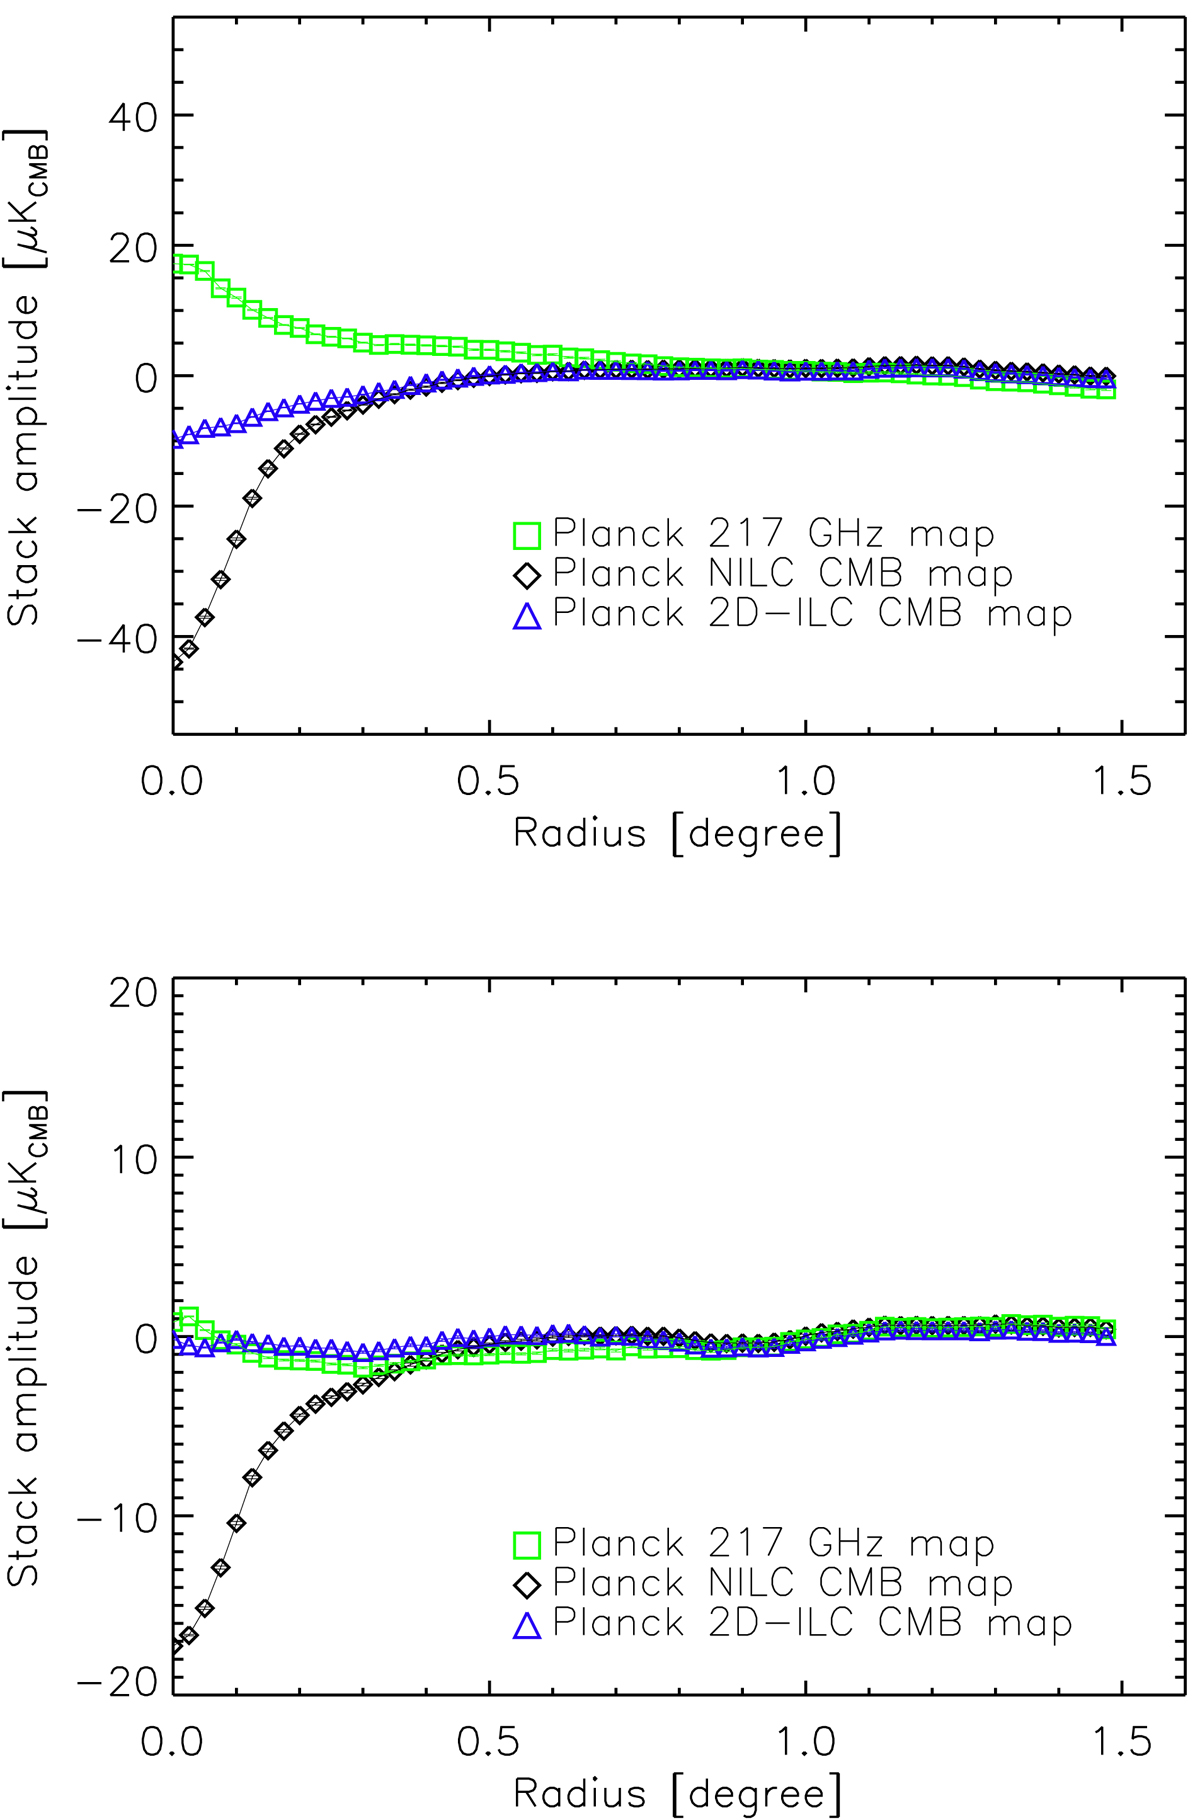
Profiles for stacked patches (see Fig. 1) of the NILC CMB map (black diamonds) and the 2D-ILC CMB map (blue triangles) at the positions of PSZ clusters (top panel) and MCXC clusters (bottom panel). The profile of the stacked Planck 217-GHz map is also shown as a reference (green squares). The central deficit in the flux profile of the stacked NILC CMB map (black diamonds) is due to residual tSZ contamination.
Current usage metrics show cumulative count of Article Views (full-text article views including HTML views, PDF and ePub downloads, according to the available data) and Abstracts Views on Vision4Press platform.
Data correspond to usage on the plateform after 2015. The current usage metrics is available 48-96 hours after online publication and is updated daily on week days.
Initial download of the metrics may take a while.