Fig. 12.
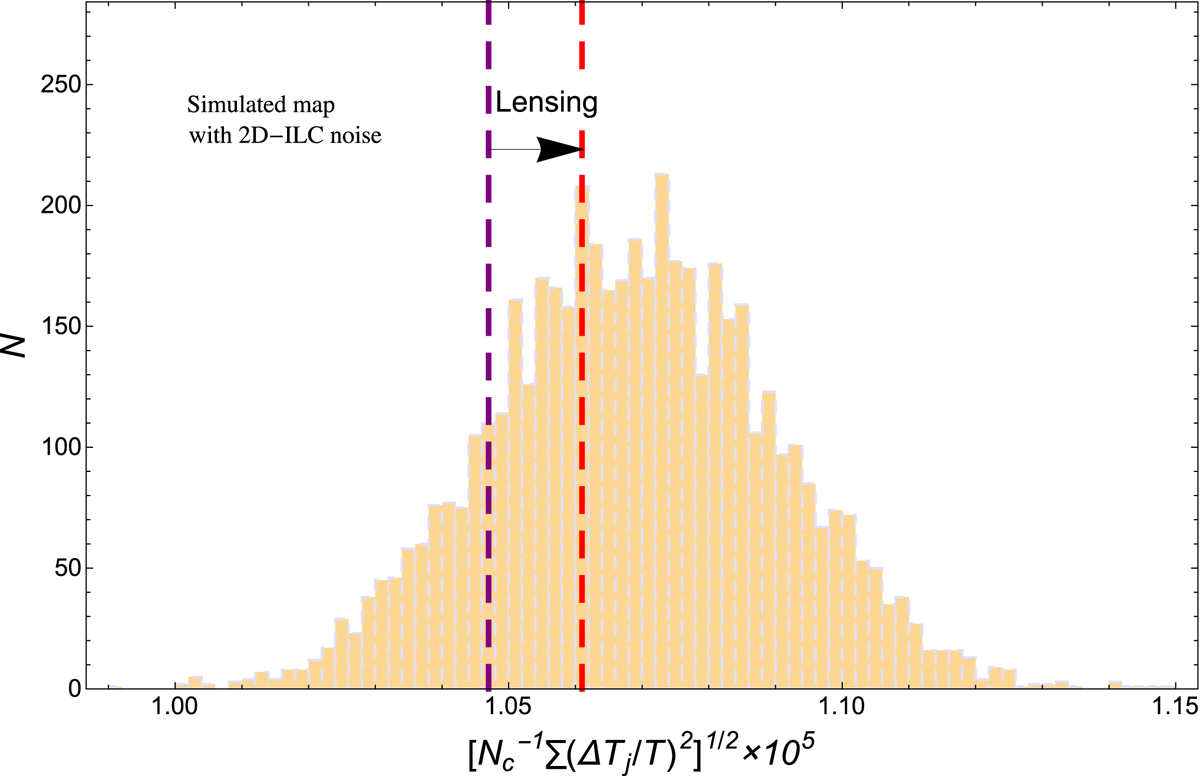
Histogram of the ![]() values of 5000 random catalogues (each having Nc = 1526) on simulated lensed skies with added 2D-ILC noise. The mean and rms for the 5000 mock catalogues are 1.07 × 10⁻⁵ and 2.13 × 10⁻⁷, respectively. The vertical dashed lines indicate the values at the MCXC cluster positions before and after the cluster-lensing effect is added; the values are 1.047 × 10⁻⁵ before (purple line) and 1.061 × 10⁻⁵ after (red line).
values of 5000 random catalogues (each having Nc = 1526) on simulated lensed skies with added 2D-ILC noise. The mean and rms for the 5000 mock catalogues are 1.07 × 10⁻⁵ and 2.13 × 10⁻⁷, respectively. The vertical dashed lines indicate the values at the MCXC cluster positions before and after the cluster-lensing effect is added; the values are 1.047 × 10⁻⁵ before (purple line) and 1.061 × 10⁻⁵ after (red line).
Current usage metrics show cumulative count of Article Views (full-text article views including HTML views, PDF and ePub downloads, according to the available data) and Abstracts Views on Vision4Press platform.
Data correspond to usage on the plateform after 2015. The current usage metrics is available 48-96 hours after online publication and is updated daily on week days.
Initial download of the metrics may take a while.