Fig. 10.
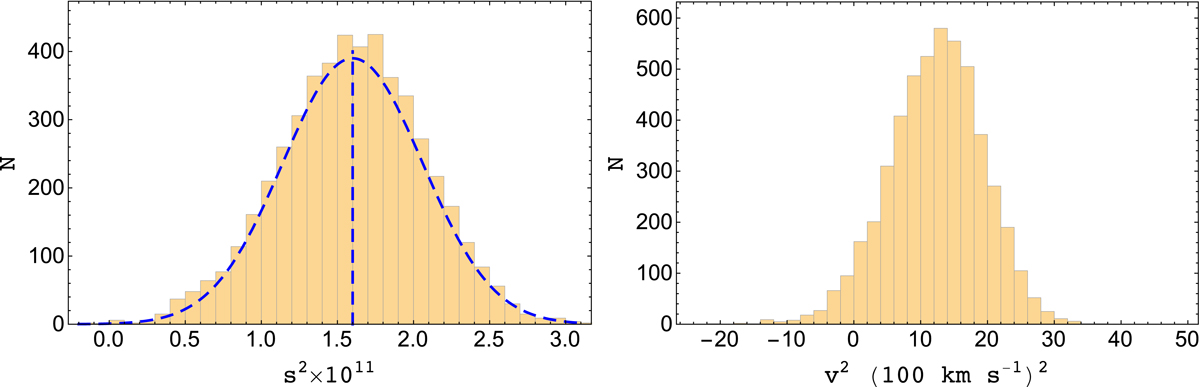
Left: distribution of 5000 values of s2 with uniform weight (Eq. (16)) on each position for the 2D-ILC map. Right: distribution of υ2 calculated from Eq. (30), after subtracting the lensing shift. The distribution has P(υ2 < 0) = 5.3%, corresponding to a (1-sided) detection of 1.6 σ. We have tested with 50 000 values of s2 and the results are consistent with those from 5000 values.
Current usage metrics show cumulative count of Article Views (full-text article views including HTML views, PDF and ePub downloads, according to the available data) and Abstracts Views on Vision4Press platform.
Data correspond to usage on the plateform after 2015. The current usage metrics is available 48-96 hours after online publication and is updated daily on week days.
Initial download of the metrics may take a while.