Fig. 1.
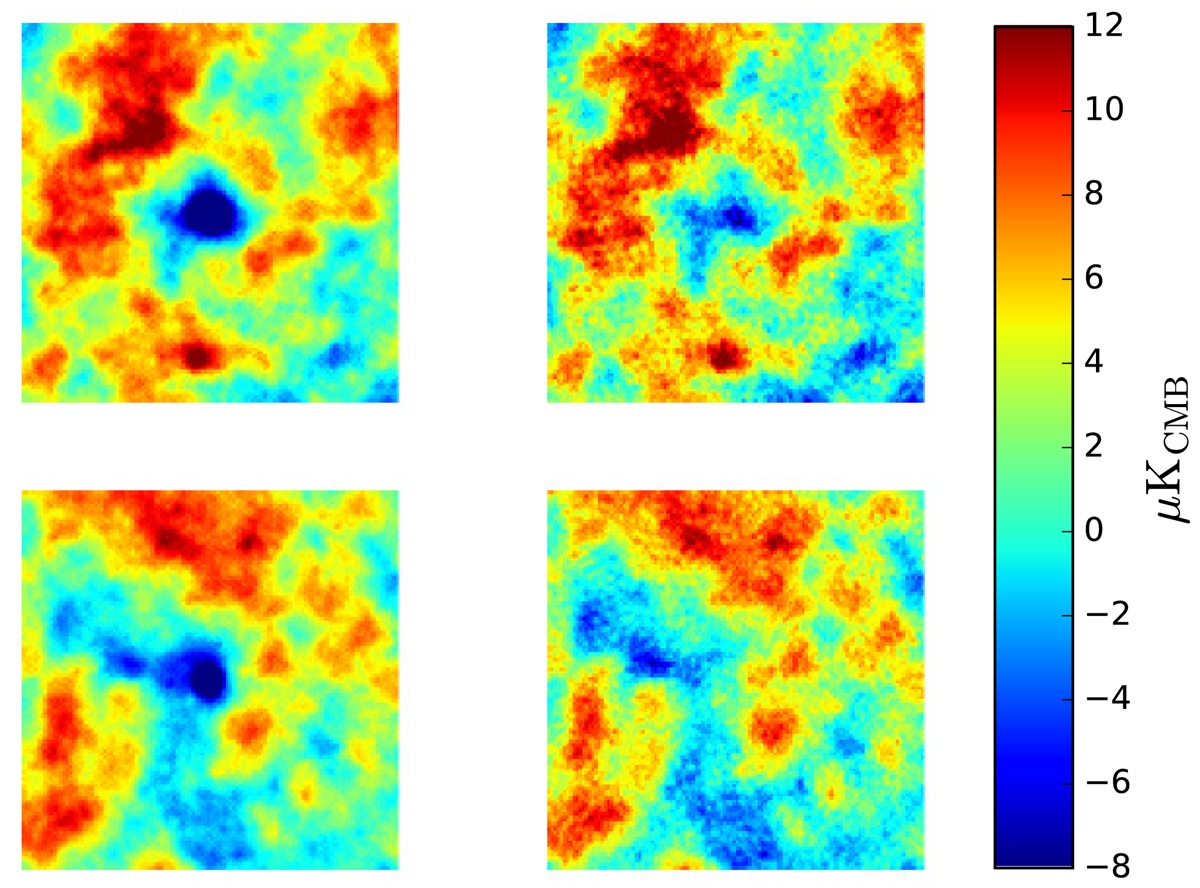
Top left: stack of the NILC CMB map in the directions of Planck SZ (PSZ) galaxy clusters. Top right: stack of the 2D-ILC CMB map in the direction of PSZ galaxy clusters. This sample provides a very stringent test of the tSZ leakage, since the PSZ positions are the known places on the sky with detectable SZ signal. The stacked NILC CMB map clearly shows an excess in the centre, which is due to residual contamination from the tSZ effect, while the 2D-ILC CMB map has a signature in the centre that is consistent with the strength of other features in the stacked image. Bottom left: stack of the NILC CMB map in the directions of MCXC clusters. Bottom right: stack of the 2D-ILC CMB map in the direction of 1526 MCXC clusters (see Sect. 2.2 for the detail of the catalogue). For a different set of sky positions, the results are broadly consistent with those for the PSZ clusters. All these maps are 3° × 3° in size, and use the same colour scale.
Current usage metrics show cumulative count of Article Views (full-text article views including HTML views, PDF and ePub downloads, according to the available data) and Abstracts Views on Vision4Press platform.
Data correspond to usage on the plateform after 2015. The current usage metrics is available 48-96 hours after online publication and is updated daily on week days.
Initial download of the metrics may take a while.