Fig. 7
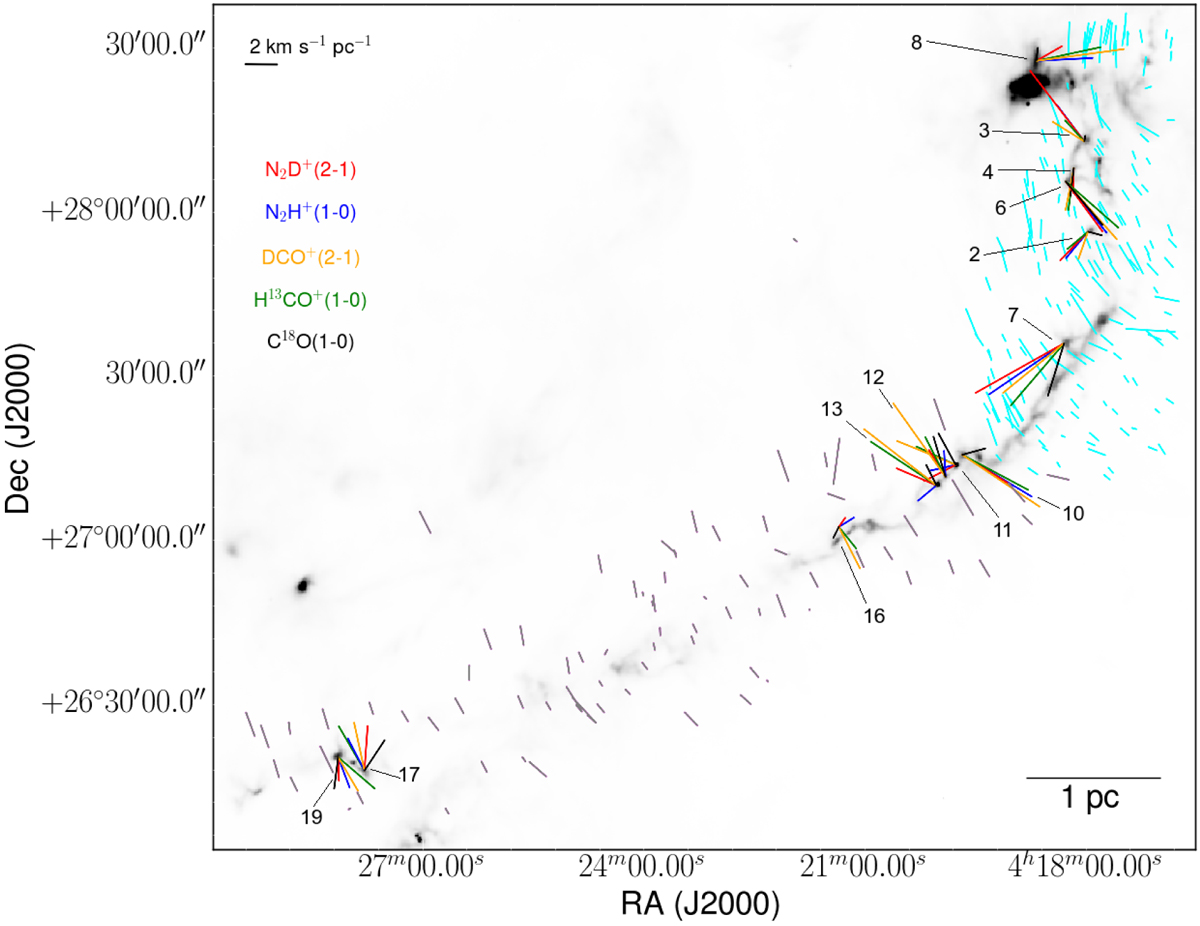
Polarization in L1495 measured with optical (Heyer et al. 1987; grey segments) and infrared (Goodman et al. 1992; Chapman et al. 2011) observations (cyan segments) and total velocity gradients across the cores (N2D+ – red, N2H+ – blue, DCO+ – orange, H13CO+ – green, and C18O – black). The colour scale shows the dust continuum emission at 500 μm obtained with Herschel/SPIRE (Palmeirim et al. 2013).
Current usage metrics show cumulative count of Article Views (full-text article views including HTML views, PDF and ePub downloads, according to the available data) and Abstracts Views on Vision4Press platform.
Data correspond to usage on the plateform after 2015. The current usage metrics is available 48-96 hours after online publication and is updated daily on week days.
Initial download of the metrics may take a while.