Fig. 6
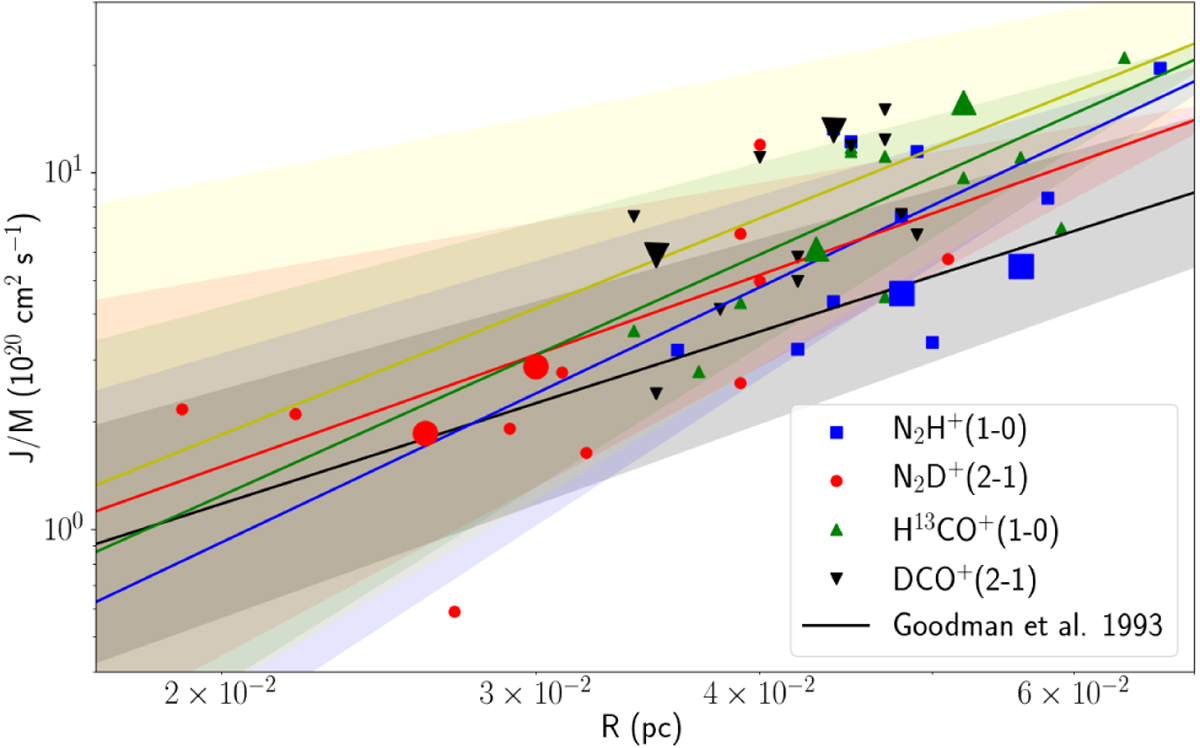
Specific angular momentum as a function of core radius measured with different lines. Large symbols show protostellar cores, small symbols show starless cores. The lines are the best fits of a power-law function aRb calculated for each species (N2H+(1–0) – blue, N2D+(2–1) – red, H13CO+(1–0) – green, DCO+(2–1) – yellow), a and b values are given in the main text. The black line shows the relation found by Goodman et al. (1993). Thick light colour strips represent the accuracies of the fits (N2H+(1–0) – light blue, N2D+(2–1) – light red, H13CO+(1–0) – light green, DCO+(2–1) – light yellow, Goodman et al. 1993 – grey).
Current usage metrics show cumulative count of Article Views (full-text article views including HTML views, PDF and ePub downloads, according to the available data) and Abstracts Views on Vision4Press platform.
Data correspond to usage on the plateform after 2015. The current usage metrics is available 48-96 hours after online publication and is updated daily on week days.
Initial download of the metrics may take a while.