Fig. 5
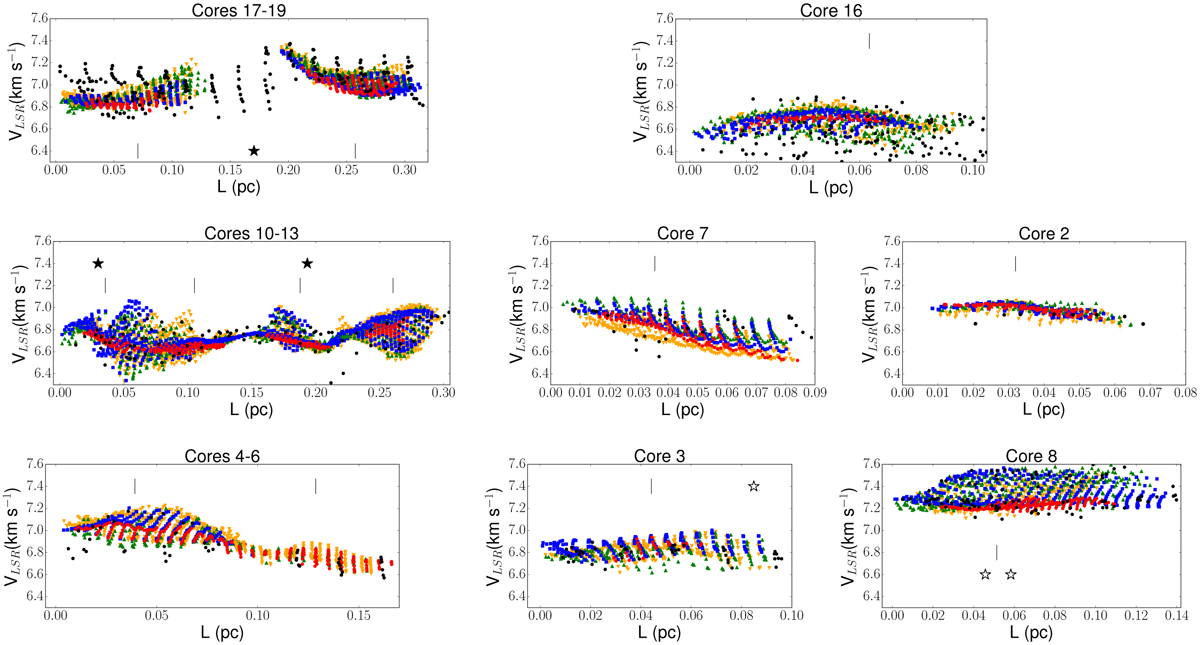
VLSR along the filament direction (from core 19 in the south-east to core 8 in the north-west). The transitions are shown with colours: N2D+(2–1) – red circles; N2H+(1–0) – blue squares; DCO+(2–1) – orange flipped triangles; H13CO+(1–0) – green triangles; and C18O(1–0) – black circles. The vertical bars show the N2H+(1–0) emission peaks. Stars show the positions of YSOs from Rebull et al. (2010): black stars indicate flat and Class I objects, white stars indicate Class II and III objects.
Current usage metrics show cumulative count of Article Views (full-text article views including HTML views, PDF and ePub downloads, according to the available data) and Abstracts Views on Vision4Press platform.
Data correspond to usage on the plateform after 2015. The current usage metrics is available 48-96 hours after online publication and is updated daily on week days.
Initial download of the metrics may take a while.