Fig. A.9
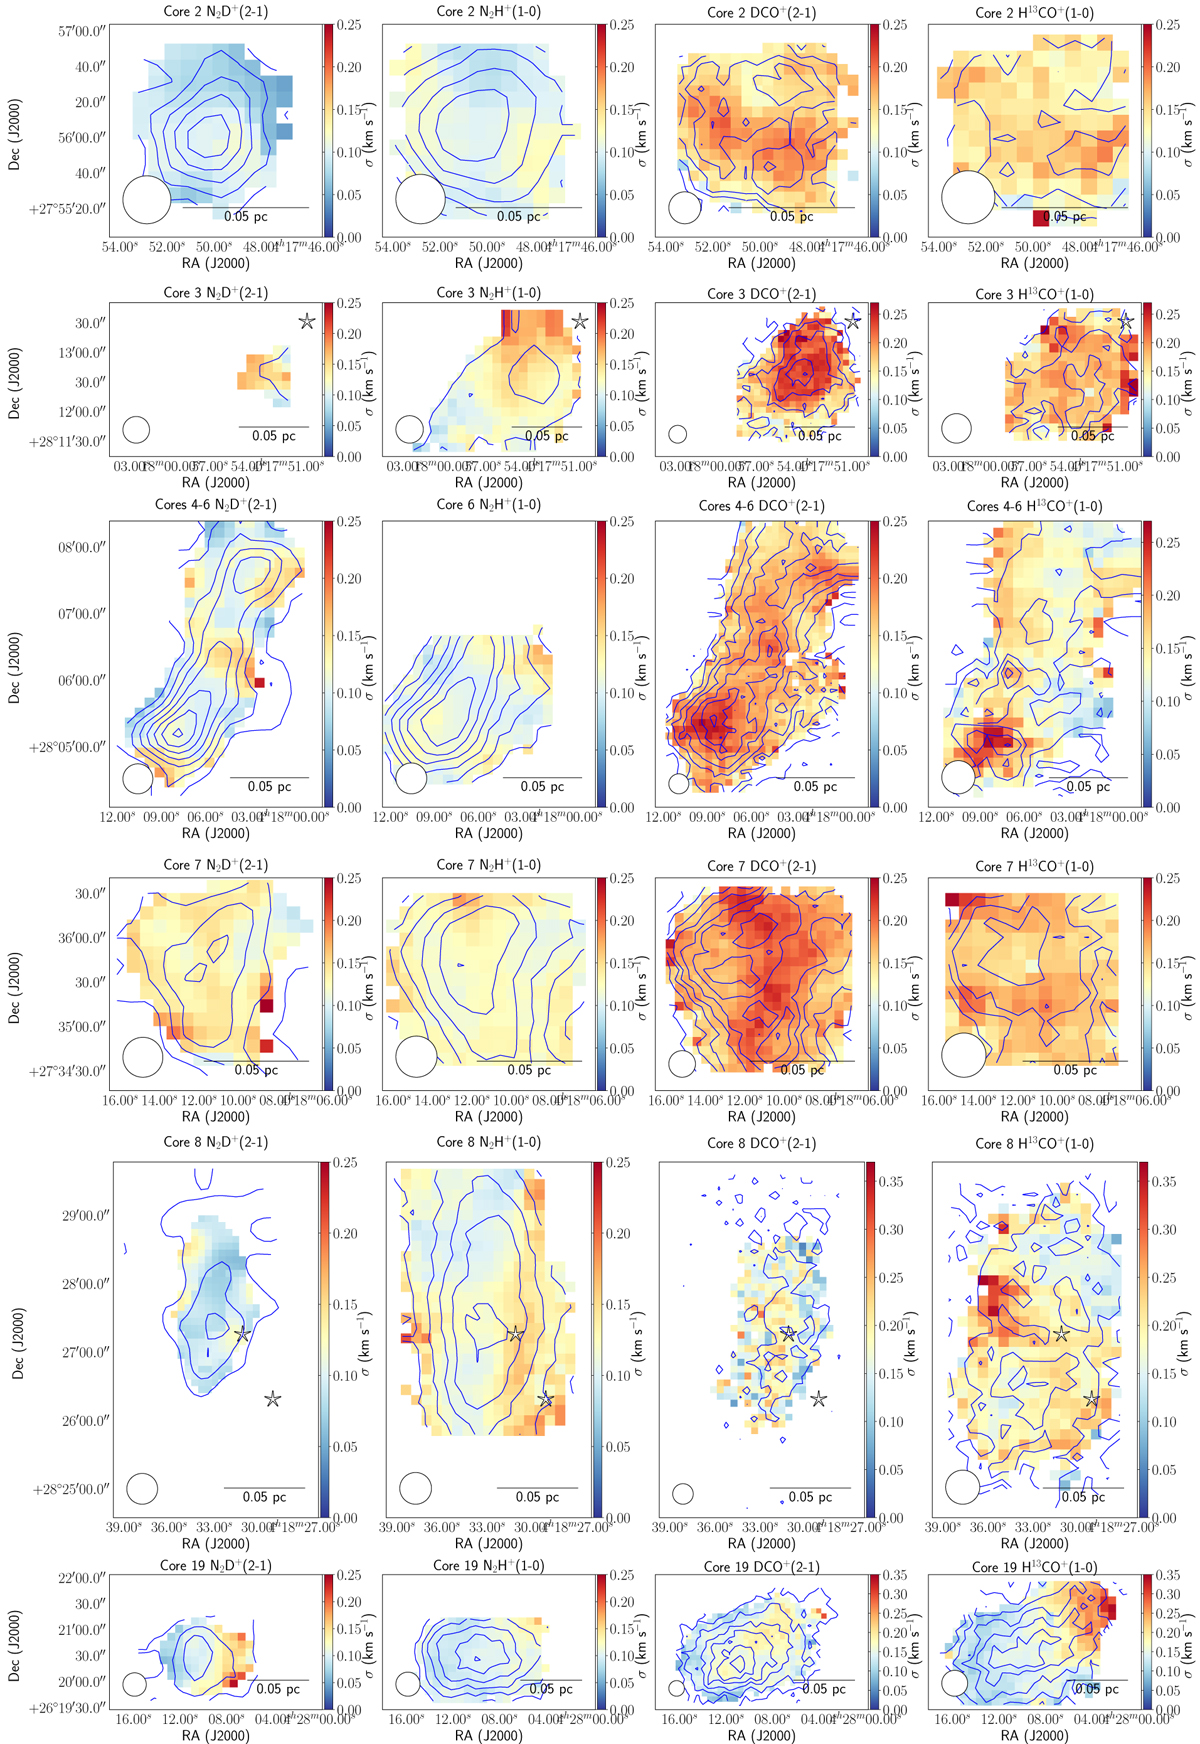
Velocity dispersions (σ) of the N2D+(2–1), N2H+(1–0), DCO+(2–1), and H13CO+(1–0) lines across the cores. Blue contours show the integrated intensities of the corresponding species. The first contour is at the 5σ level and thecontour step is 5σ. Stars show the positions of YSOs from Rebull et al. (2010): black stars indicate young, flat, and Class I objects, white stars indicate more evolved, Class II and III objects.
Current usage metrics show cumulative count of Article Views (full-text article views including HTML views, PDF and ePub downloads, according to the available data) and Abstracts Views on Vision4Press platform.
Data correspond to usage on the plateform after 2015. The current usage metrics is available 48-96 hours after online publication and is updated daily on week days.
Initial download of the metrics may take a while.