Free Access
Fig. A.7
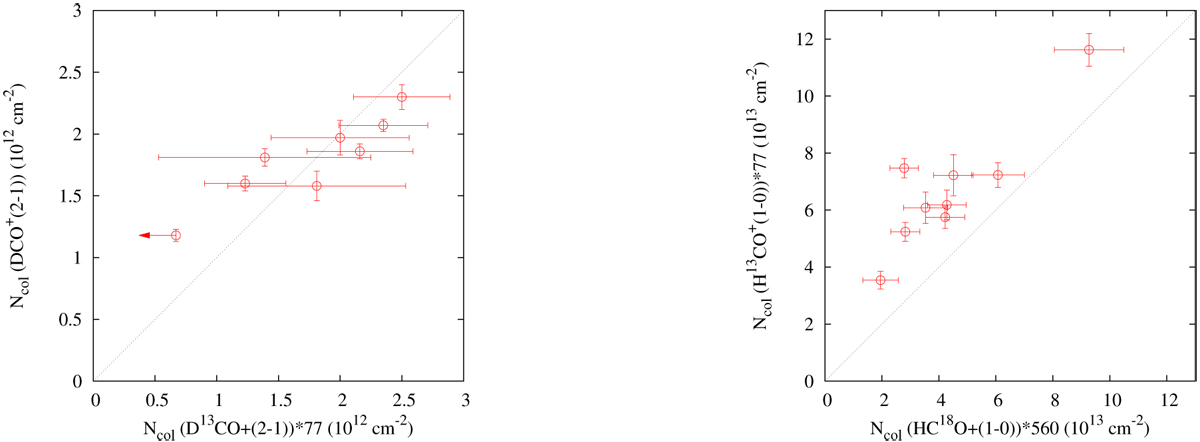
Comparison of the column densities of DCO+ (left panel) and HCO+ (right panel)towards the DCO+(2–1) emission peaks obtained with an assumption of optically thin lines. The dotted lines show one-to-one correlations.
Current usage metrics show cumulative count of Article Views (full-text article views including HTML views, PDF and ePub downloads, according to the available data) and Abstracts Views on Vision4Press platform.
Data correspond to usage on the plateform after 2015. The current usage metrics is available 48-96 hours after online publication and is updated daily on week days.
Initial download of the metrics may take a while.